Paraguayan vs Nigerian Married-couple Households
COMPARE
Paraguayan
Nigerian
Married-couple Households
Married-couple Households Comparison
Paraguayans
Nigerians
47.0%
MARRIED-COUPLE HOUSEHOLDS
78.7/ 100
METRIC RATING
149th/ 347
METRIC RANK
43.2%
MARRIED-COUPLE HOUSEHOLDS
0.1/ 100
METRIC RATING
274th/ 347
METRIC RANK
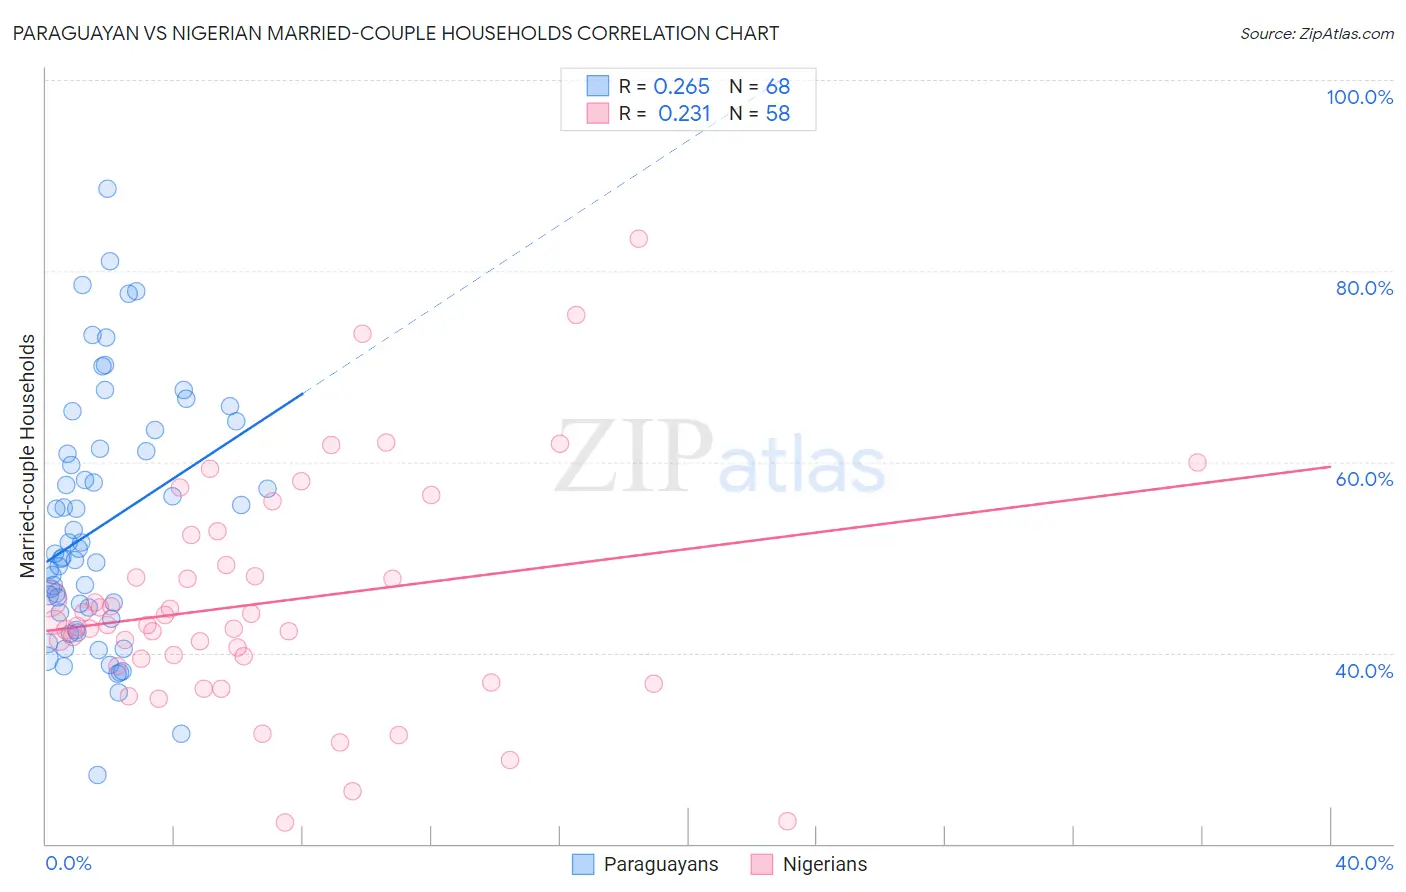
Paraguayan vs Nigerian Married-couple Households Correlation Chart
The statistical analysis conducted on geographies consisting of 95,096,913 people shows a weak positive correlation between the proportion of Paraguayans and percentage of married-couple family households in the United States with a correlation coefficient (R) of 0.265 and weighted average of 47.0%. Similarly, the statistical analysis conducted on geographies consisting of 332,444,771 people shows a weak positive correlation between the proportion of Nigerians and percentage of married-couple family households in the United States with a correlation coefficient (R) of 0.231 and weighted average of 43.2%, a difference of 8.9%.
Married-couple Households Correlation Summary
| Measurement | Paraguayan | Nigerian |
| Minimum | 27.2% | 22.2% |
| Maximum | 88.5% | 83.4% |
| Range | 61.4% | 61.2% |
| Mean | 53.2% | 45.2% |
| Median | 50.2% | 42.9% |
| Interquartile 25% (IQ1) | 43.9% | 39.4% |
| Interquartile 75% (IQ3) | 61.2% | 49.2% |
| Interquartile Range (IQR) | 17.3% | 9.7% |
| Standard Deviation (Sample) | 12.9% | 12.0% |
| Standard Deviation (Population) | 12.8% | 11.9% |
Similar Demographics by Married-couple Households
Demographics Similar to Paraguayans by Married-couple Households
In terms of married-couple households, the demographic groups most similar to Paraguayans are Icelander (47.0%, a difference of 0.050%), Immigrants from Russia (47.0%, a difference of 0.060%), Immigrants from Bulgaria (47.0%, a difference of 0.10%), Serbian (47.0%, a difference of 0.12%), and Hmong (47.0%, a difference of 0.13%).
| Demographics | Rating | Rank | Married-couple Households |
| Spaniards | 84.1 /100 | #142 | Excellent 47.2% |
| Immigrants | Belarus | 83.8 /100 | #143 | Excellent 47.2% |
| Mexicans | 83.4 /100 | #144 | Excellent 47.1% |
| Slovenes | 81.7 /100 | #145 | Excellent 47.1% |
| Immigrants | Western Europe | 81.6 /100 | #146 | Excellent 47.1% |
| Immigrants | Syria | 81.6 /100 | #147 | Excellent 47.1% |
| Icelanders | 79.5 /100 | #148 | Good 47.0% |
| Paraguayans | 78.7 /100 | #149 | Good 47.0% |
| Immigrants | Russia | 77.6 /100 | #150 | Good 47.0% |
| Immigrants | Bulgaria | 76.8 /100 | #151 | Good 47.0% |
| Serbians | 76.3 /100 | #152 | Good 47.0% |
| Hmong | 76.2 /100 | #153 | Good 47.0% |
| Immigrants | Western Asia | 76.1 /100 | #154 | Good 46.9% |
| Arabs | 76.0 /100 | #155 | Good 46.9% |
| Armenians | 75.4 /100 | #156 | Good 46.9% |
Demographics Similar to Nigerians by Married-couple Households
In terms of married-couple households, the demographic groups most similar to Nigerians are Ethiopian (43.2%, a difference of 0.010%), Immigrants from Nigeria (43.2%, a difference of 0.11%), Immigrants from Bangladesh (43.1%, a difference of 0.14%), Guatemalan (43.3%, a difference of 0.21%), and Immigrants from Ethiopia (43.1%, a difference of 0.25%).
| Demographics | Rating | Rank | Married-couple Households |
| Natives/Alaskans | 0.1 /100 | #267 | Tragic 43.5% |
| Immigrants | Burma/Myanmar | 0.1 /100 | #268 | Tragic 43.4% |
| Immigrants | Sierra Leone | 0.1 /100 | #269 | Tragic 43.3% |
| Yuman | 0.1 /100 | #270 | Tragic 43.3% |
| Guatemalans | 0.1 /100 | #271 | Tragic 43.3% |
| Immigrants | Nigeria | 0.1 /100 | #272 | Tragic 43.2% |
| Ethiopians | 0.1 /100 | #273 | Tragic 43.2% |
| Nigerians | 0.1 /100 | #274 | Tragic 43.2% |
| Immigrants | Bangladesh | 0.0 /100 | #275 | Tragic 43.1% |
| Immigrants | Ethiopia | 0.0 /100 | #276 | Tragic 43.1% |
| Immigrants | Eastern Africa | 0.0 /100 | #277 | Tragic 42.9% |
| Immigrants | Africa | 0.0 /100 | #278 | Tragic 42.9% |
| Sierra Leoneans | 0.0 /100 | #279 | Tragic 42.9% |
| Immigrants | Ecuador | 0.0 /100 | #280 | Tragic 42.9% |
| Immigrants | Guatemala | 0.0 /100 | #281 | Tragic 42.8% |