Paraguayan vs Central American Married-couple Households
COMPARE
Paraguayan
Central American
Married-couple Households
Married-couple Households Comparison
Paraguayans
Central Americans
47.0%
MARRIED-COUPLE HOUSEHOLDS
78.7/ 100
METRIC RATING
149th/ 347
METRIC RANK
43.9%
MARRIED-COUPLE HOUSEHOLDS
0.3/ 100
METRIC RATING
253rd/ 347
METRIC RANK
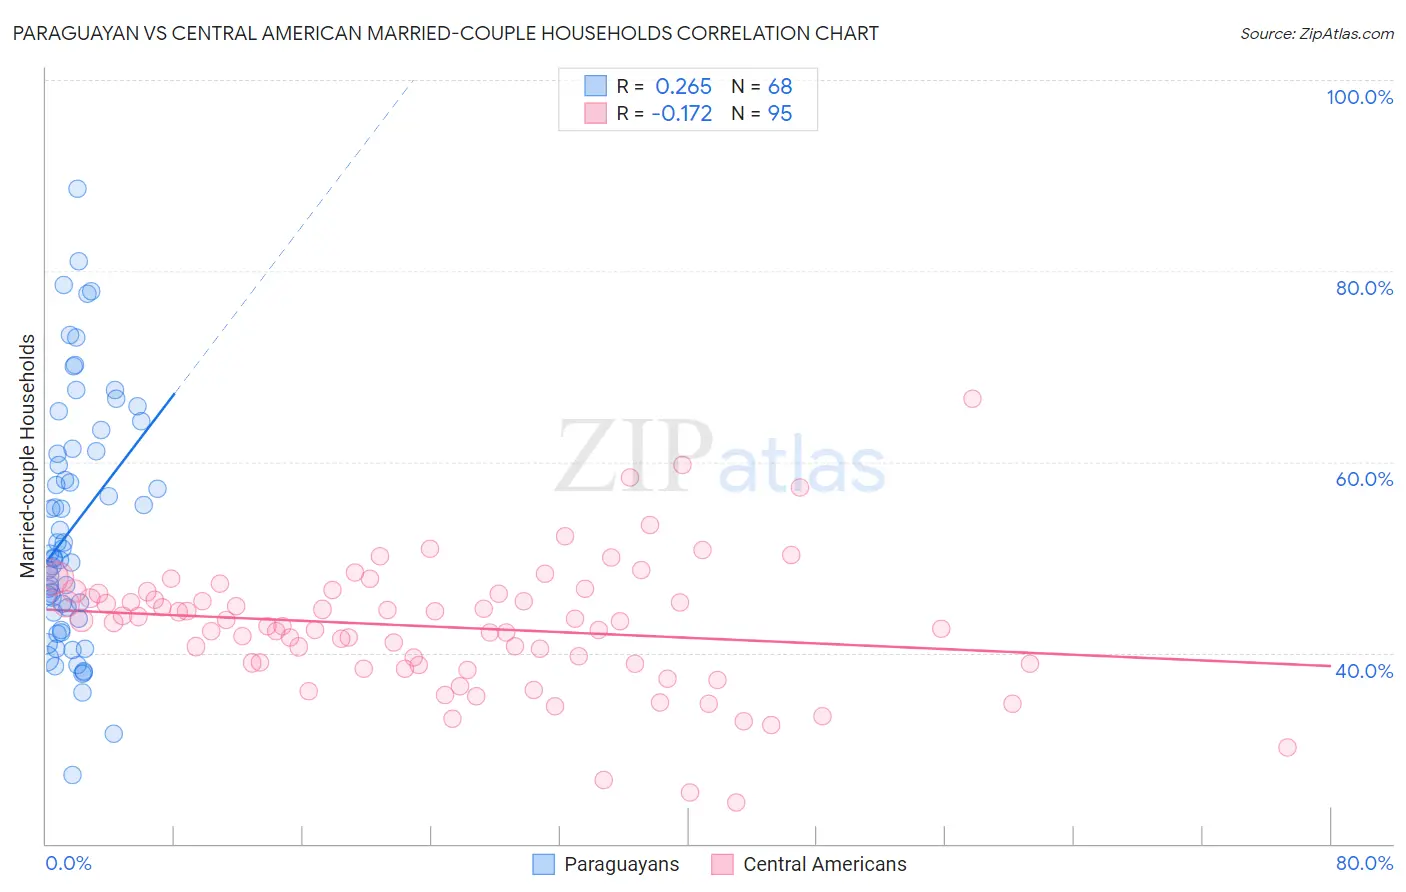
Paraguayan vs Central American Married-couple Households Correlation Chart
The statistical analysis conducted on geographies consisting of 95,096,913 people shows a weak positive correlation between the proportion of Paraguayans and percentage of married-couple family households in the United States with a correlation coefficient (R) of 0.265 and weighted average of 47.0%. Similarly, the statistical analysis conducted on geographies consisting of 504,046,022 people shows a poor negative correlation between the proportion of Central Americans and percentage of married-couple family households in the United States with a correlation coefficient (R) of -0.172 and weighted average of 43.9%, a difference of 7.0%.
Married-couple Households Correlation Summary
| Measurement | Paraguayan | Central American |
| Minimum | 27.2% | 24.4% |
| Maximum | 88.5% | 66.7% |
| Range | 61.4% | 42.3% |
| Mean | 53.2% | 42.7% |
| Median | 50.2% | 43.2% |
| Interquartile 25% (IQ1) | 43.9% | 38.9% |
| Interquartile 75% (IQ3) | 61.2% | 46.2% |
| Interquartile Range (IQR) | 17.3% | 7.3% |
| Standard Deviation (Sample) | 12.9% | 6.8% |
| Standard Deviation (Population) | 12.8% | 6.8% |
Similar Demographics by Married-couple Households
Demographics Similar to Paraguayans by Married-couple Households
In terms of married-couple households, the demographic groups most similar to Paraguayans are Icelander (47.0%, a difference of 0.050%), Immigrants from Russia (47.0%, a difference of 0.060%), Immigrants from Bulgaria (47.0%, a difference of 0.10%), Serbian (47.0%, a difference of 0.12%), and Hmong (47.0%, a difference of 0.13%).
| Demographics | Rating | Rank | Married-couple Households |
| Spaniards | 84.1 /100 | #142 | Excellent 47.2% |
| Immigrants | Belarus | 83.8 /100 | #143 | Excellent 47.2% |
| Mexicans | 83.4 /100 | #144 | Excellent 47.1% |
| Slovenes | 81.7 /100 | #145 | Excellent 47.1% |
| Immigrants | Western Europe | 81.6 /100 | #146 | Excellent 47.1% |
| Immigrants | Syria | 81.6 /100 | #147 | Excellent 47.1% |
| Icelanders | 79.5 /100 | #148 | Good 47.0% |
| Paraguayans | 78.7 /100 | #149 | Good 47.0% |
| Immigrants | Russia | 77.6 /100 | #150 | Good 47.0% |
| Immigrants | Bulgaria | 76.8 /100 | #151 | Good 47.0% |
| Serbians | 76.3 /100 | #152 | Good 47.0% |
| Hmong | 76.2 /100 | #153 | Good 47.0% |
| Immigrants | Western Asia | 76.1 /100 | #154 | Good 46.9% |
| Arabs | 76.0 /100 | #155 | Good 46.9% |
| Armenians | 75.4 /100 | #156 | Good 46.9% |
Demographics Similar to Central Americans by Married-couple Households
In terms of married-couple households, the demographic groups most similar to Central Americans are Apache (43.9%, a difference of 0.050%), Shoshone (43.9%, a difference of 0.070%), Seminole (44.0%, a difference of 0.12%), German Russian (44.0%, a difference of 0.19%), and Ugandan (43.8%, a difference of 0.21%).
| Demographics | Rating | Rank | Married-couple Households |
| Immigrants | Cuba | 0.6 /100 | #246 | Tragic 44.2% |
| Immigrants | Morocco | 0.6 /100 | #247 | Tragic 44.2% |
| Yup'ik | 0.4 /100 | #248 | Tragic 44.1% |
| Immigrants | Kenya | 0.4 /100 | #249 | Tragic 44.1% |
| French American Indians | 0.4 /100 | #250 | Tragic 44.1% |
| German Russians | 0.4 /100 | #251 | Tragic 44.0% |
| Seminole | 0.4 /100 | #252 | Tragic 44.0% |
| Central Americans | 0.3 /100 | #253 | Tragic 43.9% |
| Apache | 0.3 /100 | #254 | Tragic 43.9% |
| Shoshone | 0.3 /100 | #255 | Tragic 43.9% |
| Ugandans | 0.3 /100 | #256 | Tragic 43.8% |
| Blackfeet | 0.2 /100 | #257 | Tragic 43.8% |
| Central American Indians | 0.2 /100 | #258 | Tragic 43.8% |
| Iroquois | 0.2 /100 | #259 | Tragic 43.7% |
| Immigrants | Cameroon | 0.2 /100 | #260 | Tragic 43.7% |