Yakama vs Estonian Average Family Size
COMPARE
Yakama
Estonian
Average Family Size
Average Family Size Comparison
Yakama
Estonians
3.45
AVERAGE FAMILY SIZE
100.0/ 100
METRIC RATING
25th/ 347
METRIC RANK
3.10
AVERAGE FAMILY SIZE
0.0/ 100
METRIC RATING
333rd/ 347
METRIC RANK
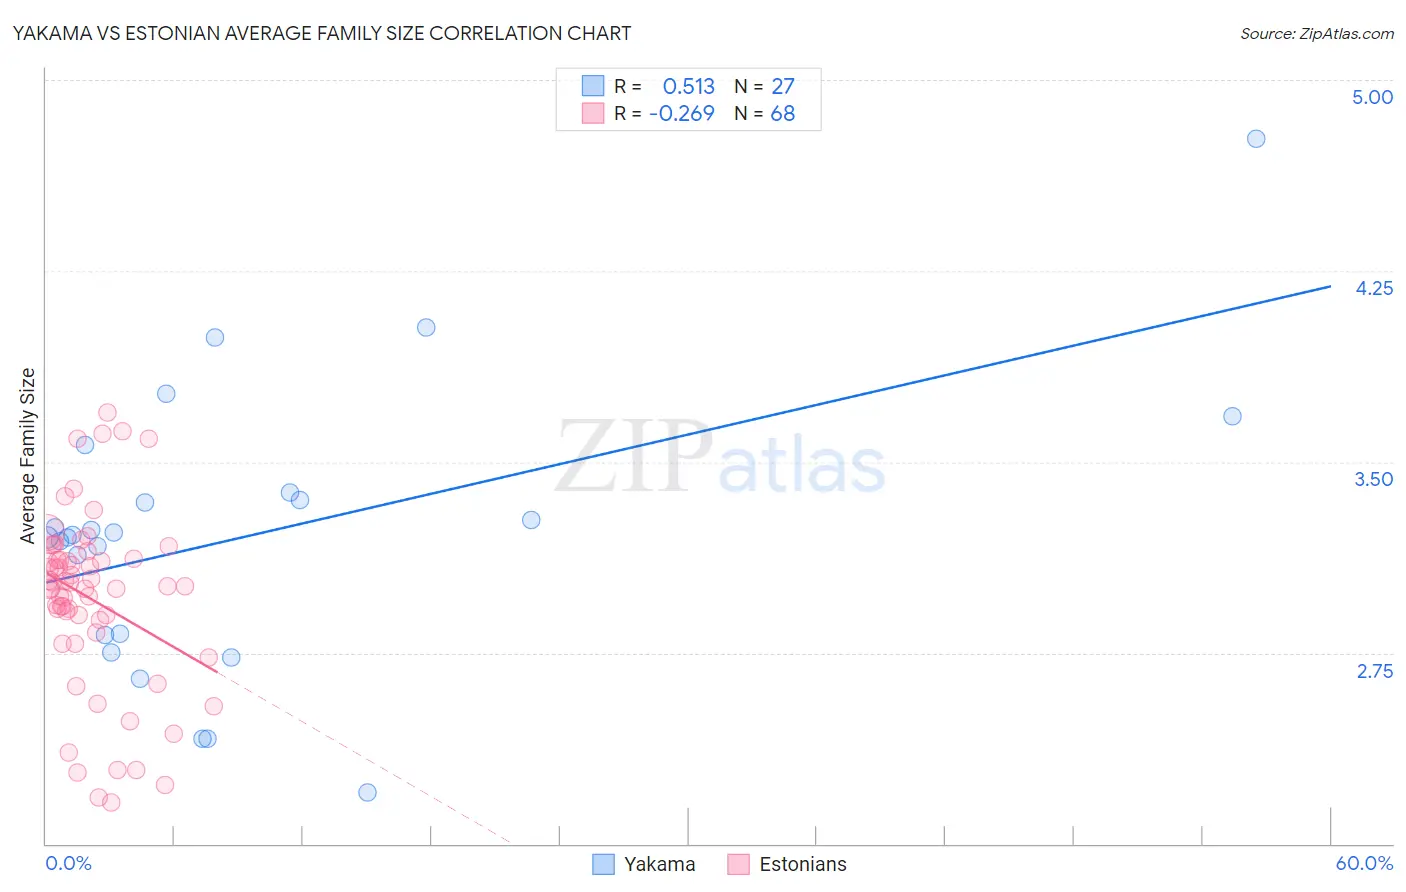
Yakama vs Estonian Average Family Size Correlation Chart
The statistical analysis conducted on geographies consisting of 19,917,879 people shows a substantial positive correlation between the proportion of Yakama and average family size in the United States with a correlation coefficient (R) of 0.513 and weighted average of 3.45. Similarly, the statistical analysis conducted on geographies consisting of 123,500,786 people shows a weak negative correlation between the proportion of Estonians and average family size in the United States with a correlation coefficient (R) of -0.269 and weighted average of 3.10, a difference of 11.0%.
Average Family Size Correlation Summary
| Measurement | Yakama | Estonian |
| Minimum | 2.20 | 2.16 |
| Maximum | 4.77 | 3.69 |
| Range | 2.57 | 1.53 |
| Mean | 3.21 | 2.96 |
| Median | 3.21 | 3.01 |
| Interquartile 25% (IQ1) | 2.82 | 2.85 |
| Interquartile 75% (IQ3) | 3.38 | 3.12 |
| Interquartile Range (IQR) | 0.56 | 0.26 |
| Standard Deviation (Sample) | 0.55 | 0.35 |
| Standard Deviation (Population) | 0.54 | 0.34 |
Similar Demographics by Average Family Size
Demographics Similar to Yakama by Average Family Size
In terms of average family size, the demographic groups most similar to Yakama are Native/Alaskan (3.45, a difference of 0.11%), Immigrants from Fiji (3.45, a difference of 0.23%), Native Hawaiian (3.43, a difference of 0.51%), Apache (3.46, a difference of 0.52%), and Mexican American Indian (3.43, a difference of 0.52%).
| Demographics | Rating | Rank | Average Family Size |
| Salvadorans | 100.0 /100 | #18 | Exceptional 3.48 |
| Mexicans | 100.0 /100 | #19 | Exceptional 3.48 |
| Cheyenne | 100.0 /100 | #20 | Exceptional 3.47 |
| Yuman | 100.0 /100 | #21 | Exceptional 3.47 |
| Apache | 100.0 /100 | #22 | Exceptional 3.46 |
| Immigrants | Fiji | 100.0 /100 | #23 | Exceptional 3.45 |
| Natives/Alaskans | 100.0 /100 | #24 | Exceptional 3.45 |
| Yakama | 100.0 /100 | #25 | Exceptional 3.45 |
| Native Hawaiians | 100.0 /100 | #26 | Exceptional 3.43 |
| Mexican American Indians | 100.0 /100 | #27 | Exceptional 3.43 |
| Immigrants | Latin America | 100.0 /100 | #28 | Exceptional 3.42 |
| Nepalese | 100.0 /100 | #29 | Exceptional 3.42 |
| Samoans | 100.0 /100 | #30 | Exceptional 3.42 |
| Central Americans | 100.0 /100 | #31 | Exceptional 3.41 |
| Immigrants | Guatemala | 100.0 /100 | #32 | Exceptional 3.41 |
Demographics Similar to Estonians by Average Family Size
In terms of average family size, the demographic groups most similar to Estonians are Lithuanian (3.10, a difference of 0.0%), Luxembourger (3.10, a difference of 0.030%), Latvian (3.11, a difference of 0.050%), Scotch-Irish (3.11, a difference of 0.050%), and Scottish (3.11, a difference of 0.050%).
| Demographics | Rating | Rank | Average Family Size |
| Ottawa | 0.0 /100 | #326 | Tragic 3.11 |
| Dutch | 0.0 /100 | #327 | Tragic 3.11 |
| Czechs | 0.0 /100 | #328 | Tragic 3.11 |
| Belgians | 0.0 /100 | #329 | Tragic 3.11 |
| Latvians | 0.0 /100 | #330 | Tragic 3.11 |
| Scotch-Irish | 0.0 /100 | #331 | Tragic 3.11 |
| Scottish | 0.0 /100 | #332 | Tragic 3.11 |
| Estonians | 0.0 /100 | #333 | Tragic 3.10 |
| Lithuanians | 0.0 /100 | #334 | Tragic 3.10 |
| Luxembourgers | 0.0 /100 | #335 | Tragic 3.10 |
| Irish | 0.0 /100 | #336 | Tragic 3.10 |
| Swedes | 0.0 /100 | #337 | Tragic 3.10 |
| French | 0.0 /100 | #338 | Tragic 3.10 |
| Croatians | 0.0 /100 | #339 | Tragic 3.10 |
| Finns | 0.0 /100 | #340 | Tragic 3.09 |