Pakistani vs Estonian Per Capita Income
COMPARE
Pakistani
Estonian
Per Capita Income
Per Capita Income Comparison
Pakistanis
Estonians
$45,587
PER CAPITA INCOME
89.7/ 100
METRIC RATING
133rd/ 347
METRIC RANK
$51,875
PER CAPITA INCOME
100.0/ 100
METRIC RATING
37th/ 347
METRIC RANK
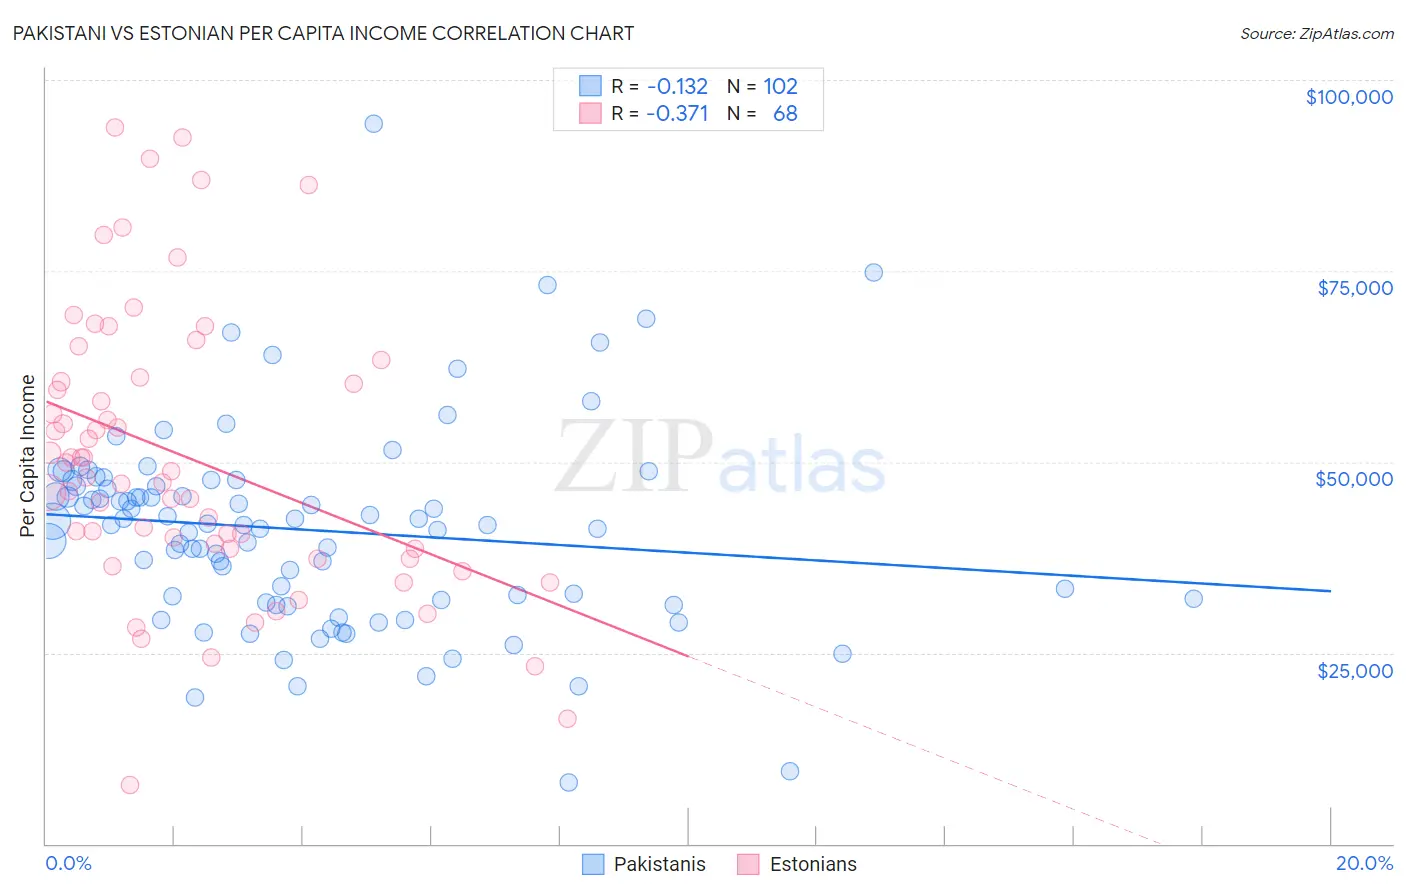
Pakistani vs Estonian Per Capita Income Correlation Chart
The statistical analysis conducted on geographies consisting of 335,371,609 people shows a poor negative correlation between the proportion of Pakistanis and per capita income in the United States with a correlation coefficient (R) of -0.132 and weighted average of $45,587. Similarly, the statistical analysis conducted on geographies consisting of 123,528,060 people shows a mild negative correlation between the proportion of Estonians and per capita income in the United States with a correlation coefficient (R) of -0.371 and weighted average of $51,875, a difference of 13.8%.
Per Capita Income Correlation Summary
| Measurement | Pakistani | Estonian |
| Minimum | $8,026 | $7,734 |
| Maximum | $94,275 | $93,762 |
| Range | $86,249 | $86,028 |
| Mean | $41,080 | $50,630 |
| Median | $41,744 | $48,349 |
| Interquartile 25% (IQ1) | $31,965 | $38,645 |
| Interquartile 75% (IQ3) | $46,855 | $60,738 |
| Interquartile Range (IQR) | $14,890 | $22,093 |
| Standard Deviation (Sample) | $13,251 | $18,388 |
| Standard Deviation (Population) | $13,186 | $18,253 |
Similar Demographics by Per Capita Income
Demographics Similar to Pakistanis by Per Capita Income
In terms of per capita income, the demographic groups most similar to Pakistanis are Slovene ($45,581, a difference of 0.010%), Jordanian ($45,605, a difference of 0.040%), Immigrants from North Macedonia ($45,622, a difference of 0.080%), Arab ($45,662, a difference of 0.16%), and Luxembourger ($45,663, a difference of 0.17%).
| Demographics | Rating | Rank | Per Capita Income |
| Palestinians | 91.6 /100 | #126 | Exceptional $45,790 |
| Immigrants | Germany | 91.3 /100 | #127 | Exceptional $45,751 |
| Swedes | 91.3 /100 | #128 | Exceptional $45,750 |
| Luxembourgers | 90.4 /100 | #129 | Exceptional $45,663 |
| Arabs | 90.4 /100 | #130 | Exceptional $45,662 |
| Immigrants | North Macedonia | 90.0 /100 | #131 | Exceptional $45,622 |
| Jordanians | 89.9 /100 | #132 | Excellent $45,605 |
| Pakistanis | 89.7 /100 | #133 | Excellent $45,587 |
| Slovenes | 89.6 /100 | #134 | Excellent $45,581 |
| Hungarians | 87.9 /100 | #135 | Excellent $45,426 |
| Immigrants | Oceania | 85.2 /100 | #136 | Excellent $45,220 |
| Immigrants | Syria | 85.2 /100 | #137 | Excellent $45,218 |
| Assyrians/Chaldeans/Syriacs | 84.8 /100 | #138 | Excellent $45,195 |
| Basques | 83.2 /100 | #139 | Excellent $45,086 |
| Immigrants | Jordan | 82.9 /100 | #140 | Excellent $45,066 |
Demographics Similar to Estonians by Per Capita Income
In terms of per capita income, the demographic groups most similar to Estonians are Immigrants from Greece ($51,891, a difference of 0.030%), Immigrants from Czechoslovakia ($51,770, a difference of 0.20%), Burmese ($52,005, a difference of 0.25%), Cambodian ($51,731, a difference of 0.28%), and Immigrants from Russia ($52,044, a difference of 0.33%).
| Demographics | Rating | Rank | Per Capita Income |
| Immigrants | Austria | 100.0 /100 | #30 | Exceptional $52,503 |
| Turks | 100.0 /100 | #31 | Exceptional $52,391 |
| Immigrants | Norway | 100.0 /100 | #32 | Exceptional $52,217 |
| Australians | 100.0 /100 | #33 | Exceptional $52,074 |
| Immigrants | Russia | 100.0 /100 | #34 | Exceptional $52,044 |
| Burmese | 100.0 /100 | #35 | Exceptional $52,005 |
| Immigrants | Greece | 100.0 /100 | #36 | Exceptional $51,891 |
| Estonians | 100.0 /100 | #37 | Exceptional $51,875 |
| Immigrants | Czechoslovakia | 100.0 /100 | #38 | Exceptional $51,770 |
| Cambodians | 100.0 /100 | #39 | Exceptional $51,731 |
| Immigrants | Korea | 100.0 /100 | #40 | Exceptional $51,671 |
| Immigrants | South Africa | 100.0 /100 | #41 | Exceptional $51,465 |
| Immigrants | Turkey | 100.0 /100 | #42 | Exceptional $51,368 |
| Immigrants | Lithuania | 100.0 /100 | #43 | Exceptional $51,361 |
| Immigrants | Europe | 100.0 /100 | #44 | Exceptional $50,950 |