Nonimmigrants vs Trinidadian and Tobagonian Family Households
COMPARE
Nonimmigrants
Trinidadian and Tobagonian
Family Households
Family Households Comparison
Nonimmigrants
Trinidadians and Tobagonians
64.8%
FAMILY HOUSEHOLDS
90.1/ 100
METRIC RATING
131st/ 347
METRIC RANK
63.6%
FAMILY HOUSEHOLDS
4.1/ 100
METRIC RATING
227th/ 347
METRIC RANK
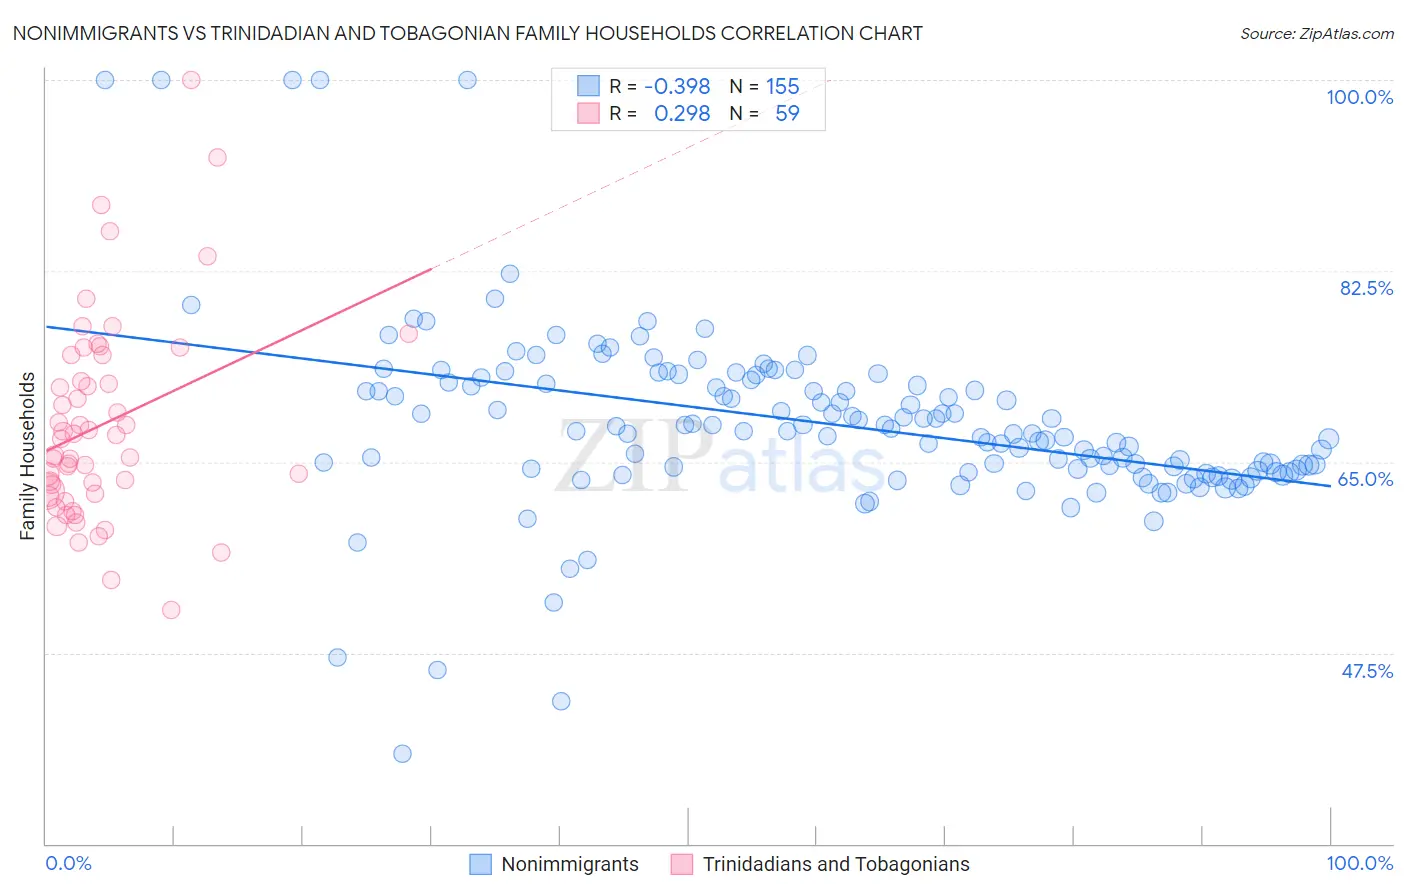
Nonimmigrants vs Trinidadian and Tobagonian Family Households Correlation Chart
The statistical analysis conducted on geographies consisting of 584,651,779 people shows a mild negative correlation between the proportion of Nonimmigrants and percentage of family households in the United States with a correlation coefficient (R) of -0.398 and weighted average of 64.8%. Similarly, the statistical analysis conducted on geographies consisting of 219,716,618 people shows a weak positive correlation between the proportion of Trinidadians and Tobagonians and percentage of family households in the United States with a correlation coefficient (R) of 0.298 and weighted average of 63.6%, a difference of 1.8%.
Family Households Correlation Summary
| Measurement | Nonimmigrants | Trinidadian and Tobagonian |
| Minimum | 38.2% | 51.4% |
| Maximum | 100.0% | 100.0% |
| Range | 61.8% | 48.6% |
| Mean | 68.5% | 68.4% |
| Median | 67.8% | 67.1% |
| Interquartile 25% (IQ1) | 64.2% | 62.1% |
| Interquartile 75% (IQ3) | 72.3% | 74.7% |
| Interquartile Range (IQR) | 8.1% | 12.7% |
| Standard Deviation (Sample) | 8.6% | 9.3% |
| Standard Deviation (Population) | 8.6% | 9.2% |
Similar Demographics by Family Households
Demographics Similar to Nonimmigrants by Family Households
In terms of family households, the demographic groups most similar to Nonimmigrants are Immigrants from Italy (64.8%, a difference of 0.010%), Cajun (64.8%, a difference of 0.020%), Belizean (64.8%, a difference of 0.030%), Immigrants from Ecuador (64.8%, a difference of 0.050%), and Italian (64.8%, a difference of 0.070%).
| Demographics | Rating | Rank | Family Households |
| Immigrants | Argentina | 92.8 /100 | #124 | Exceptional 64.9% |
| Immigrants | Belize | 92.7 /100 | #125 | Exceptional 64.9% |
| Panamanians | 92.4 /100 | #126 | Exceptional 64.8% |
| Immigrants | Panama | 92.0 /100 | #127 | Exceptional 64.8% |
| Italians | 91.9 /100 | #128 | Exceptional 64.8% |
| Immigrants | Ecuador | 91.4 /100 | #129 | Exceptional 64.8% |
| Immigrants | Italy | 90.2 /100 | #130 | Exceptional 64.8% |
| Immigrants | Nonimmigrants | 90.1 /100 | #131 | Exceptional 64.8% |
| Cajuns | 89.4 /100 | #132 | Excellent 64.8% |
| Belizeans | 89.3 /100 | #133 | Excellent 64.8% |
| Greeks | 88.1 /100 | #134 | Excellent 64.7% |
| Maltese | 87.4 /100 | #135 | Excellent 64.7% |
| Immigrants | China | 86.6 /100 | #136 | Excellent 64.7% |
| Immigrants | Scotland | 86.4 /100 | #137 | Excellent 64.7% |
| Basques | 85.5 /100 | #138 | Excellent 64.7% |
Demographics Similar to Trinidadians and Tobagonians by Family Households
In terms of family households, the demographic groups most similar to Trinidadians and Tobagonians are Immigrants from Bahamas (63.6%, a difference of 0.010%), Immigrants from Hungary (63.6%, a difference of 0.020%), Turkish (63.6%, a difference of 0.030%), Blackfeet (63.6%, a difference of 0.050%), and Bulgarian (63.6%, a difference of 0.070%).
| Demographics | Rating | Rank | Family Households |
| Immigrants | Europe | 6.4 /100 | #220 | Tragic 63.7% |
| Immigrants | South Africa | 5.9 /100 | #221 | Tragic 63.7% |
| Immigrants | Belarus | 5.5 /100 | #222 | Tragic 63.7% |
| French Canadians | 5.4 /100 | #223 | Tragic 63.7% |
| Turks | 4.5 /100 | #224 | Tragic 63.6% |
| Immigrants | Hungary | 4.3 /100 | #225 | Tragic 63.6% |
| Immigrants | Bahamas | 4.2 /100 | #226 | Tragic 63.6% |
| Trinidadians and Tobagonians | 4.1 /100 | #227 | Tragic 63.6% |
| Blackfeet | 3.6 /100 | #228 | Tragic 63.6% |
| Bulgarians | 3.4 /100 | #229 | Tragic 63.6% |
| Immigrants | Brazil | 3.0 /100 | #230 | Tragic 63.6% |
| Immigrants | Greece | 2.9 /100 | #231 | Tragic 63.5% |
| Immigrants | Northern Africa | 2.6 /100 | #232 | Tragic 63.5% |
| Immigrants | Armenia | 2.6 /100 | #233 | Tragic 63.5% |
| Finns | 2.3 /100 | #234 | Tragic 63.5% |