Nonimmigrants vs Trinidadian and Tobagonian Single Mother Poverty
COMPARE
Nonimmigrants
Trinidadian and Tobagonian
Single Mother Poverty
Single Mother Poverty Comparison
Nonimmigrants
Trinidadians and Tobagonians
32.2%
SINGLE MOTHER POVERTY
0.0/ 100
METRIC RATING
280th/ 347
METRIC RANK
29.6%
SINGLE MOTHER POVERTY
21.7/ 100
METRIC RATING
198th/ 347
METRIC RANK
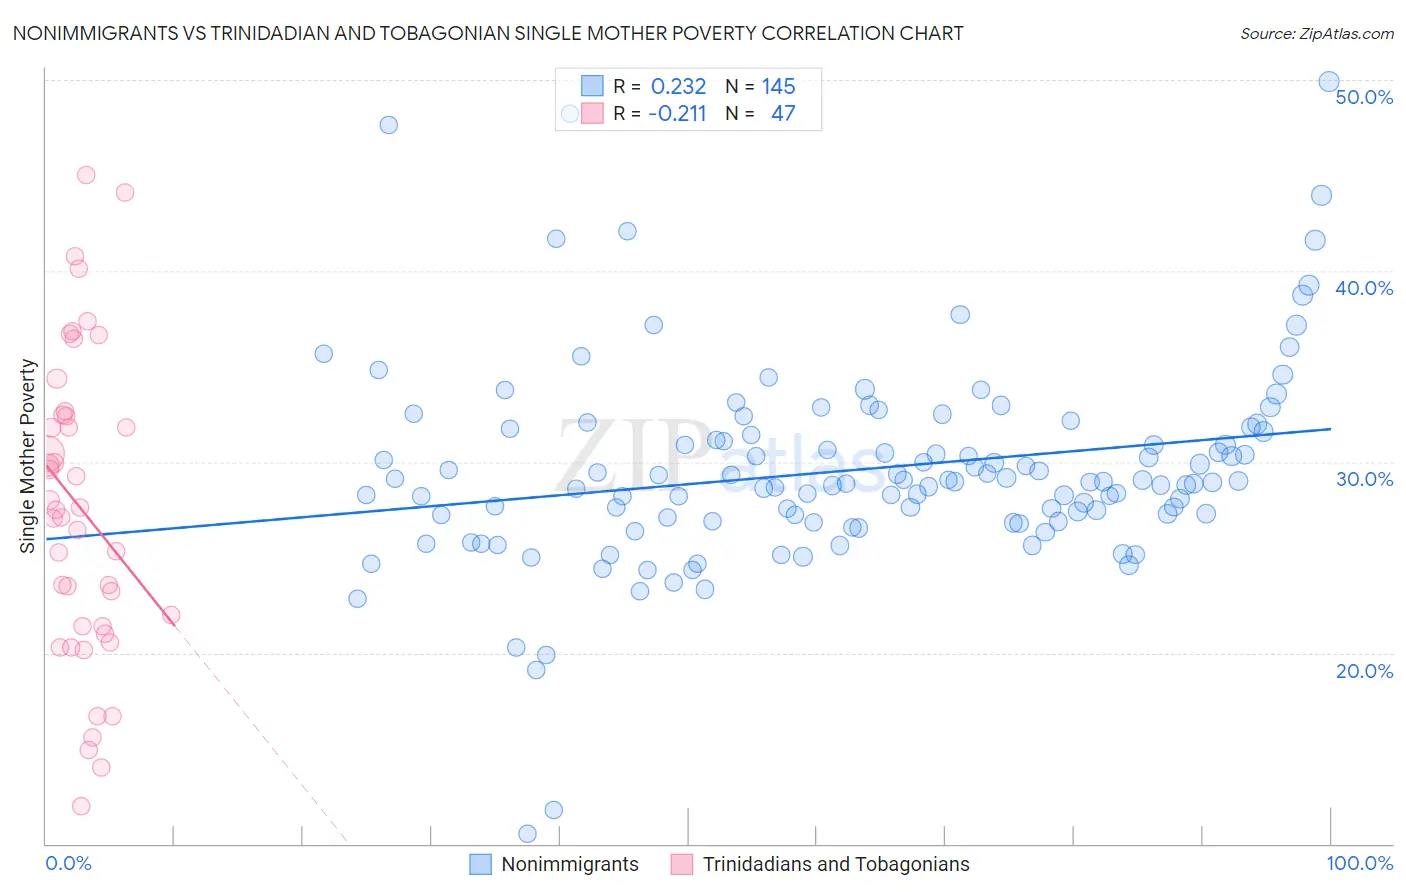
Nonimmigrants vs Trinidadian and Tobagonian Single Mother Poverty Correlation Chart
The statistical analysis conducted on geographies consisting of 553,388,851 people shows a weak positive correlation between the proportion of Nonimmigrants and poverty level among single mothers in the United States with a correlation coefficient (R) of 0.232 and weighted average of 32.2%. Similarly, the statistical analysis conducted on geographies consisting of 216,680,407 people shows a weak negative correlation between the proportion of Trinidadians and Tobagonians and poverty level among single mothers in the United States with a correlation coefficient (R) of -0.211 and weighted average of 29.6%, a difference of 8.6%.
Single Mother Poverty Correlation Summary
| Measurement | Nonimmigrants | Trinidadian and Tobagonian |
| Minimum | 10.6% | 12.0% |
| Maximum | 49.9% | 45.0% |
| Range | 39.4% | 33.0% |
| Mean | 29.6% | 27.6% |
| Median | 29.0% | 27.5% |
| Interquartile 25% (IQ1) | 27.0% | 21.4% |
| Interquartile 75% (IQ3) | 31.7% | 32.5% |
| Interquartile Range (IQR) | 4.7% | 11.1% |
| Standard Deviation (Sample) | 5.4% | 8.0% |
| Standard Deviation (Population) | 5.4% | 7.9% |
Similar Demographics by Single Mother Poverty
Demographics Similar to Nonimmigrants by Single Mother Poverty
In terms of single mother poverty, the demographic groups most similar to Nonimmigrants are Cree (32.2%, a difference of 0.030%), Immigrants from the Azores (32.2%, a difference of 0.14%), Marshallese (32.1%, a difference of 0.22%), Spanish American (32.3%, a difference of 0.39%), and Immigrants from Zaire (32.0%, a difference of 0.62%).
| Demographics | Rating | Rank | Single Mother Poverty |
| Fijians | 0.1 /100 | #273 | Tragic 31.6% |
| Bangladeshis | 0.1 /100 | #274 | Tragic 31.7% |
| Central Americans | 0.1 /100 | #275 | Tragic 31.8% |
| Delaware | 0.0 /100 | #276 | Tragic 31.8% |
| Mexican American Indians | 0.0 /100 | #277 | Tragic 31.9% |
| Immigrants | Zaire | 0.0 /100 | #278 | Tragic 32.0% |
| Marshallese | 0.0 /100 | #279 | Tragic 32.1% |
| Immigrants | Nonimmigrants | 0.0 /100 | #280 | Tragic 32.2% |
| Cree | 0.0 /100 | #281 | Tragic 32.2% |
| Immigrants | Azores | 0.0 /100 | #282 | Tragic 32.2% |
| Spanish Americans | 0.0 /100 | #283 | Tragic 32.3% |
| Indonesians | 0.0 /100 | #284 | Tragic 32.4% |
| Immigrants | Latin America | 0.0 /100 | #285 | Tragic 32.4% |
| Yup'ik | 0.0 /100 | #286 | Tragic 32.5% |
| Immigrants | Dominica | 0.0 /100 | #287 | Tragic 32.5% |
Demographics Similar to Trinidadians and Tobagonians by Single Mother Poverty
In terms of single mother poverty, the demographic groups most similar to Trinidadians and Tobagonians are Immigrants from Jamaica (29.6%, a difference of 0.020%), Cuban (29.6%, a difference of 0.070%), Spanish American Indian (29.6%, a difference of 0.11%), Panamanian (29.6%, a difference of 0.12%), and Slavic (29.6%, a difference of 0.18%).
| Demographics | Rating | Rank | Single Mother Poverty |
| Immigrants | Trinidad and Tobago | 29.2 /100 | #191 | Fair 29.5% |
| Moroccans | 28.6 /100 | #192 | Fair 29.5% |
| Basques | 28.3 /100 | #193 | Fair 29.5% |
| Icelanders | 26.1 /100 | #194 | Fair 29.5% |
| Slavs | 24.5 /100 | #195 | Fair 29.6% |
| Spanish American Indians | 23.4 /100 | #196 | Fair 29.6% |
| Immigrants | Jamaica | 22.0 /100 | #197 | Fair 29.6% |
| Trinidadians and Tobagonians | 21.7 /100 | #198 | Fair 29.6% |
| Cubans | 20.8 /100 | #199 | Fair 29.6% |
| Panamanians | 20.0 /100 | #200 | Fair 29.6% |
| Belgians | 18.8 /100 | #201 | Poor 29.7% |
| Malaysians | 17.4 /100 | #202 | Poor 29.7% |
| Swiss | 17.2 /100 | #203 | Poor 29.7% |
| Immigrants | Immigrants | 16.6 /100 | #204 | Poor 29.7% |
| Czechoslovakians | 16.1 /100 | #205 | Poor 29.7% |