Nonimmigrants vs Hispanic or Latino Family Households
COMPARE
Nonimmigrants
Hispanic or Latino
Family Households
Family Households Comparison
Nonimmigrants
Hispanics or Latinos
64.8%
FAMILY HOUSEHOLDS
90.1/ 100
METRIC RATING
131st/ 347
METRIC RANK
67.4%
FAMILY HOUSEHOLDS
100.0/ 100
METRIC RATING
27th/ 347
METRIC RANK
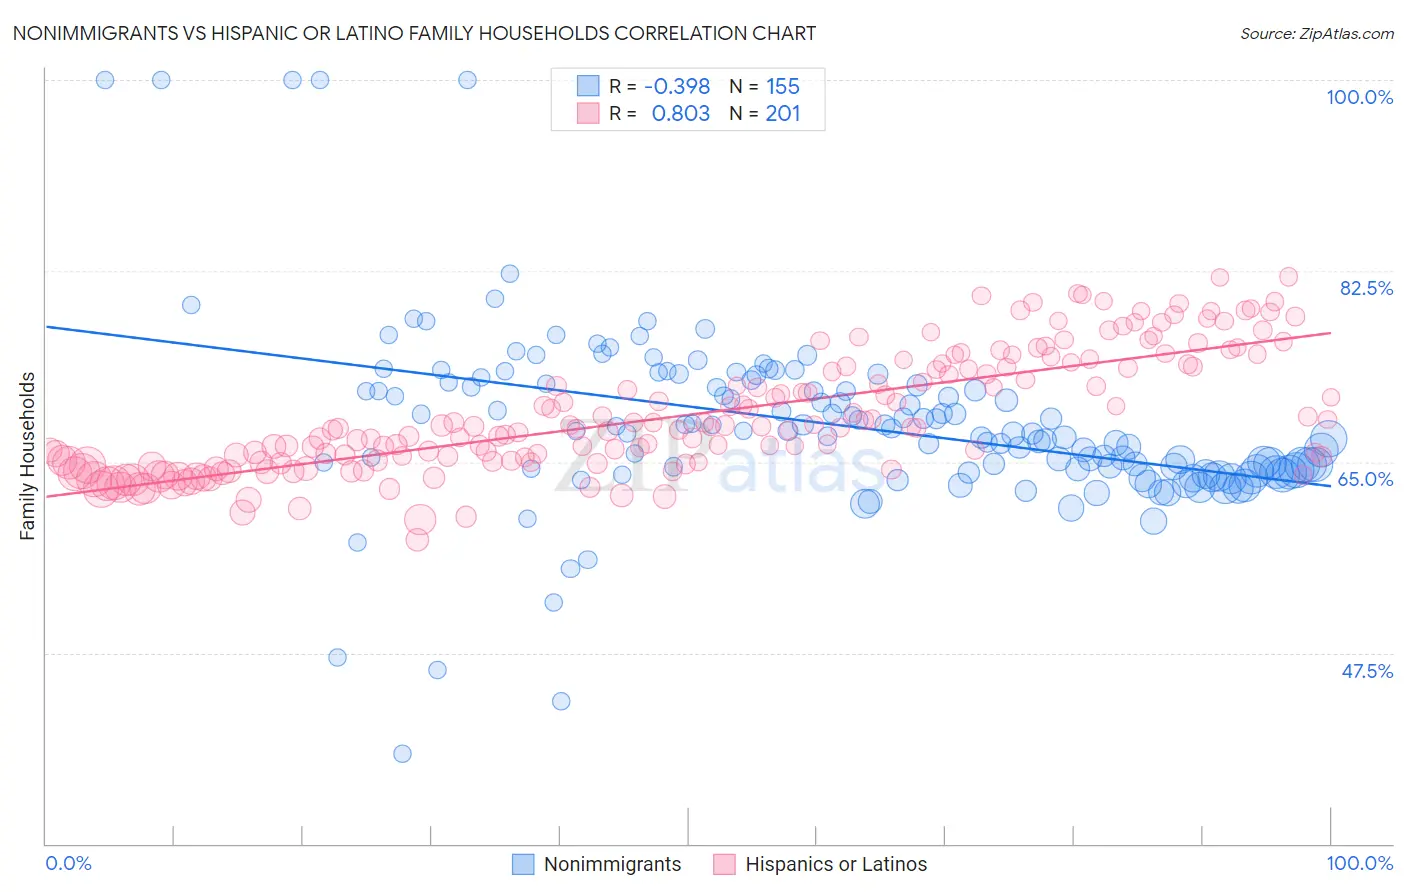
Nonimmigrants vs Hispanic or Latino Family Households Correlation Chart
The statistical analysis conducted on geographies consisting of 584,651,779 people shows a mild negative correlation between the proportion of Nonimmigrants and percentage of family households in the United States with a correlation coefficient (R) of -0.398 and weighted average of 64.8%. Similarly, the statistical analysis conducted on geographies consisting of 577,913,054 people shows a very strong positive correlation between the proportion of Hispanics or Latinos and percentage of family households in the United States with a correlation coefficient (R) of 0.803 and weighted average of 67.4%, a difference of 4.1%.
Family Households Correlation Summary
| Measurement | Nonimmigrants | Hispanic or Latino |
| Minimum | 38.2% | 57.8% |
| Maximum | 100.0% | 82.0% |
| Range | 61.8% | 24.1% |
| Mean | 68.5% | 69.3% |
| Median | 67.8% | 68.2% |
| Interquartile 25% (IQ1) | 64.2% | 65.0% |
| Interquartile 75% (IQ3) | 72.3% | 73.7% |
| Interquartile Range (IQR) | 8.1% | 8.7% |
| Standard Deviation (Sample) | 8.6% | 5.4% |
| Standard Deviation (Population) | 8.6% | 5.4% |
Similar Demographics by Family Households
Demographics Similar to Nonimmigrants by Family Households
In terms of family households, the demographic groups most similar to Nonimmigrants are Immigrants from Italy (64.8%, a difference of 0.010%), Cajun (64.8%, a difference of 0.020%), Belizean (64.8%, a difference of 0.030%), Immigrants from Ecuador (64.8%, a difference of 0.050%), and Italian (64.8%, a difference of 0.070%).
| Demographics | Rating | Rank | Family Households |
| Immigrants | Argentina | 92.8 /100 | #124 | Exceptional 64.9% |
| Immigrants | Belize | 92.7 /100 | #125 | Exceptional 64.9% |
| Panamanians | 92.4 /100 | #126 | Exceptional 64.8% |
| Immigrants | Panama | 92.0 /100 | #127 | Exceptional 64.8% |
| Italians | 91.9 /100 | #128 | Exceptional 64.8% |
| Immigrants | Ecuador | 91.4 /100 | #129 | Exceptional 64.8% |
| Immigrants | Italy | 90.2 /100 | #130 | Exceptional 64.8% |
| Immigrants | Nonimmigrants | 90.1 /100 | #131 | Exceptional 64.8% |
| Cajuns | 89.4 /100 | #132 | Excellent 64.8% |
| Belizeans | 89.3 /100 | #133 | Excellent 64.8% |
| Greeks | 88.1 /100 | #134 | Excellent 64.7% |
| Maltese | 87.4 /100 | #135 | Excellent 64.7% |
| Immigrants | China | 86.6 /100 | #136 | Excellent 64.7% |
| Immigrants | Scotland | 86.4 /100 | #137 | Excellent 64.7% |
| Basques | 85.5 /100 | #138 | Excellent 64.7% |
Demographics Similar to Hispanics or Latinos by Family Households
In terms of family households, the demographic groups most similar to Hispanics or Latinos are Hawaiian (67.4%, a difference of 0.010%), Immigrants from India (67.4%, a difference of 0.040%), Immigrants from Nicaragua (67.5%, a difference of 0.050%), Immigrants from South Eastern Asia (67.5%, a difference of 0.080%), and Nicaraguan (67.4%, a difference of 0.080%).
| Demographics | Rating | Rank | Family Households |
| Inupiat | 100.0 /100 | #20 | Exceptional 67.8% |
| Cubans | 100.0 /100 | #21 | Exceptional 67.7% |
| Sri Lankans | 100.0 /100 | #22 | Exceptional 67.7% |
| Immigrants | Pakistan | 100.0 /100 | #23 | Exceptional 67.7% |
| Immigrants | South Eastern Asia | 100.0 /100 | #24 | Exceptional 67.5% |
| Immigrants | Nicaragua | 100.0 /100 | #25 | Exceptional 67.5% |
| Immigrants | India | 100.0 /100 | #26 | Exceptional 67.4% |
| Hispanics or Latinos | 100.0 /100 | #27 | Exceptional 67.4% |
| Hawaiians | 100.0 /100 | #28 | Exceptional 67.4% |
| Nicaraguans | 100.0 /100 | #29 | Exceptional 67.4% |
| Immigrants | Peru | 100.0 /100 | #30 | Exceptional 67.2% |
| Immigrants | Latin America | 100.0 /100 | #31 | Exceptional 67.2% |
| Nepalese | 100.0 /100 | #32 | Exceptional 67.2% |
| Salvadorans | 100.0 /100 | #33 | Exceptional 67.2% |
| Thais | 100.0 /100 | #34 | Exceptional 67.2% |