Immigrants from Uzbekistan vs Trinidadian and Tobagonian Family Households
COMPARE
Immigrants from Uzbekistan
Trinidadian and Tobagonian
Family Households
Family Households Comparison
Immigrants from Uzbekistan
Trinidadians and Tobagonians
63.4%
FAMILY HOUSEHOLDS
1.5/ 100
METRIC RATING
247th/ 347
METRIC RANK
63.6%
FAMILY HOUSEHOLDS
4.1/ 100
METRIC RATING
227th/ 347
METRIC RANK
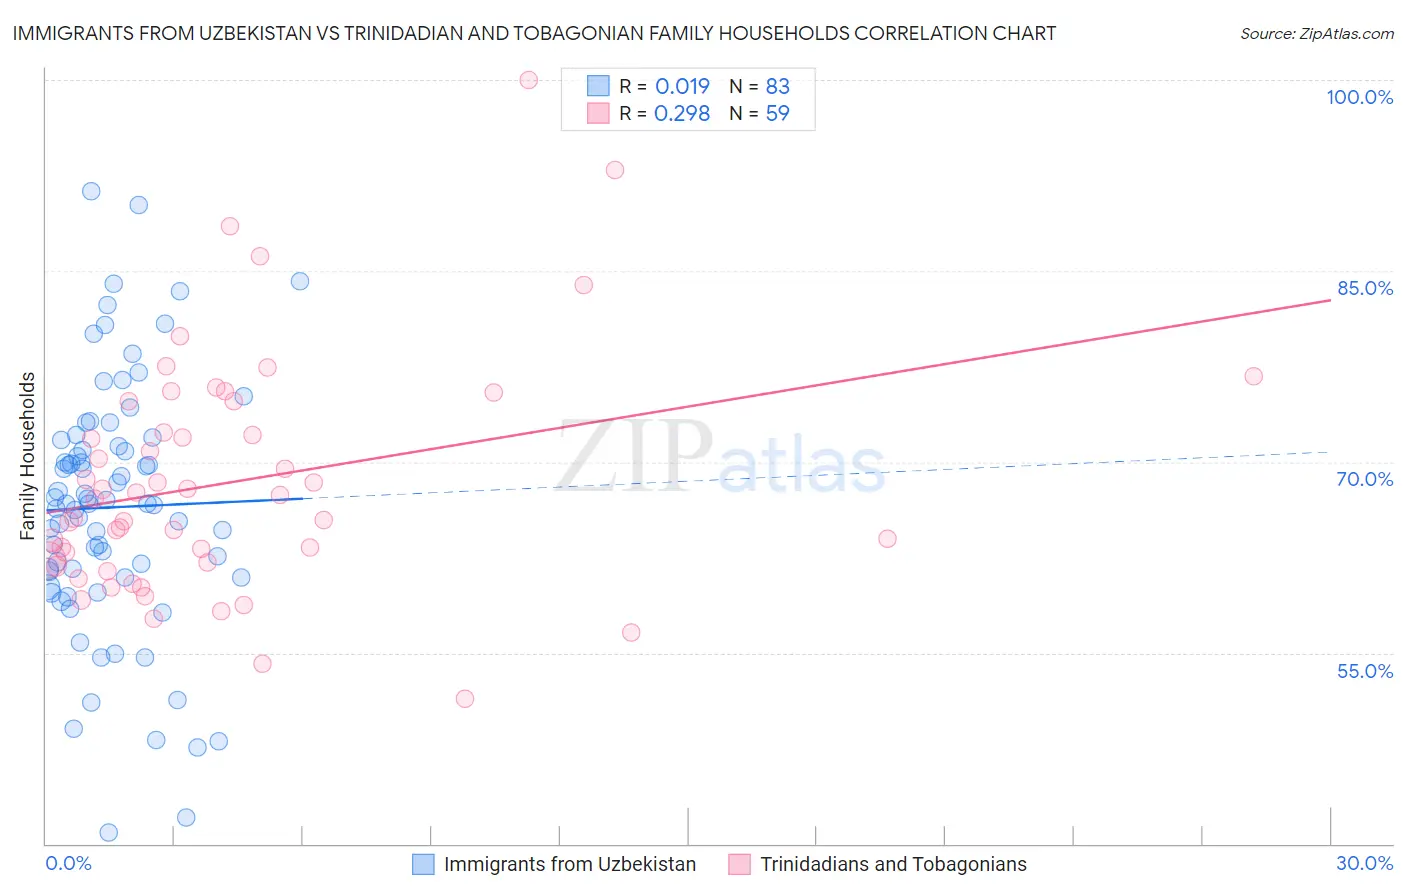
Immigrants from Uzbekistan vs Trinidadian and Tobagonian Family Households Correlation Chart
The statistical analysis conducted on geographies consisting of 118,723,370 people shows no correlation between the proportion of Immigrants from Uzbekistan and percentage of family households in the United States with a correlation coefficient (R) of 0.019 and weighted average of 63.4%. Similarly, the statistical analysis conducted on geographies consisting of 219,716,618 people shows a weak positive correlation between the proportion of Trinidadians and Tobagonians and percentage of family households in the United States with a correlation coefficient (R) of 0.298 and weighted average of 63.6%, a difference of 0.35%.
Family Households Correlation Summary
| Measurement | Immigrants from Uzbekistan | Trinidadian and Tobagonian |
| Minimum | 40.8% | 51.4% |
| Maximum | 91.2% | 100.0% |
| Range | 50.4% | 48.6% |
| Mean | 66.4% | 68.4% |
| Median | 66.7% | 67.1% |
| Interquartile 25% (IQ1) | 60.9% | 62.1% |
| Interquartile 75% (IQ3) | 71.7% | 74.7% |
| Interquartile Range (IQR) | 10.8% | 12.7% |
| Standard Deviation (Sample) | 9.9% | 9.3% |
| Standard Deviation (Population) | 9.9% | 9.2% |
Demographics Similar to Immigrants from Uzbekistan and Trinidadians and Tobagonians by Family Households
In terms of family households, the demographic groups most similar to Immigrants from Uzbekistan are Immigrants from Ghana (63.4%, a difference of 0.010%), Eastern European (63.4%, a difference of 0.030%), Immigrants from Dominica (63.4%, a difference of 0.030%), Immigrants from Czechoslovakia (63.4%, a difference of 0.050%), and Immigrants from St. Vincent and the Grenadines (63.4%, a difference of 0.070%). Similarly, the demographic groups most similar to Trinidadians and Tobagonians are Blackfeet (63.6%, a difference of 0.050%), Bulgarian (63.6%, a difference of 0.070%), Immigrants from Brazil (63.6%, a difference of 0.11%), Immigrants from Greece (63.5%, a difference of 0.12%), and Immigrants from Northern Africa (63.5%, a difference of 0.16%).
| Demographics | Rating | Rank | Family Households |
| Trinidadians and Tobagonians | 4.1 /100 | #227 | Tragic 63.6% |
| Blackfeet | 3.6 /100 | #228 | Tragic 63.6% |
| Bulgarians | 3.4 /100 | #229 | Tragic 63.6% |
| Immigrants | Brazil | 3.0 /100 | #230 | Tragic 63.6% |
| Immigrants | Greece | 2.9 /100 | #231 | Tragic 63.5% |
| Immigrants | Northern Africa | 2.6 /100 | #232 | Tragic 63.5% |
| Immigrants | Armenia | 2.6 /100 | #233 | Tragic 63.5% |
| Finns | 2.3 /100 | #234 | Tragic 63.5% |
| Albanians | 2.2 /100 | #235 | Tragic 63.5% |
| Ghanaians | 2.1 /100 | #236 | Tragic 63.5% |
| Comanche | 2.1 /100 | #237 | Tragic 63.5% |
| Immigrants | Zimbabwe | 2.0 /100 | #238 | Tragic 63.5% |
| Aleuts | 1.9 /100 | #239 | Tragic 63.4% |
| South Africans | 1.9 /100 | #240 | Tragic 63.4% |
| Immigrants | St. Vincent and the Grenadines | 1.9 /100 | #241 | Tragic 63.4% |
| Immigrants | Israel | 1.8 /100 | #242 | Tragic 63.4% |
| Immigrants | Czechoslovakia | 1.8 /100 | #243 | Tragic 63.4% |
| Eastern Europeans | 1.6 /100 | #244 | Tragic 63.4% |
| Immigrants | Dominica | 1.6 /100 | #245 | Tragic 63.4% |
| Immigrants | Ghana | 1.6 /100 | #246 | Tragic 63.4% |
| Immigrants | Uzbekistan | 1.5 /100 | #247 | Tragic 63.4% |