Nonimmigrants vs Trinidadian and Tobagonian Vision Disability
COMPARE
Nonimmigrants
Trinidadian and Tobagonian
Vision Disability
Vision Disability Comparison
Nonimmigrants
Trinidadians and Tobagonians
2.5%
VISION DISABILITY
0.0/ 100
METRIC RATING
289th/ 347
METRIC RANK
2.2%
VISION DISABILITY
8.2/ 100
METRIC RATING
214th/ 347
METRIC RANK
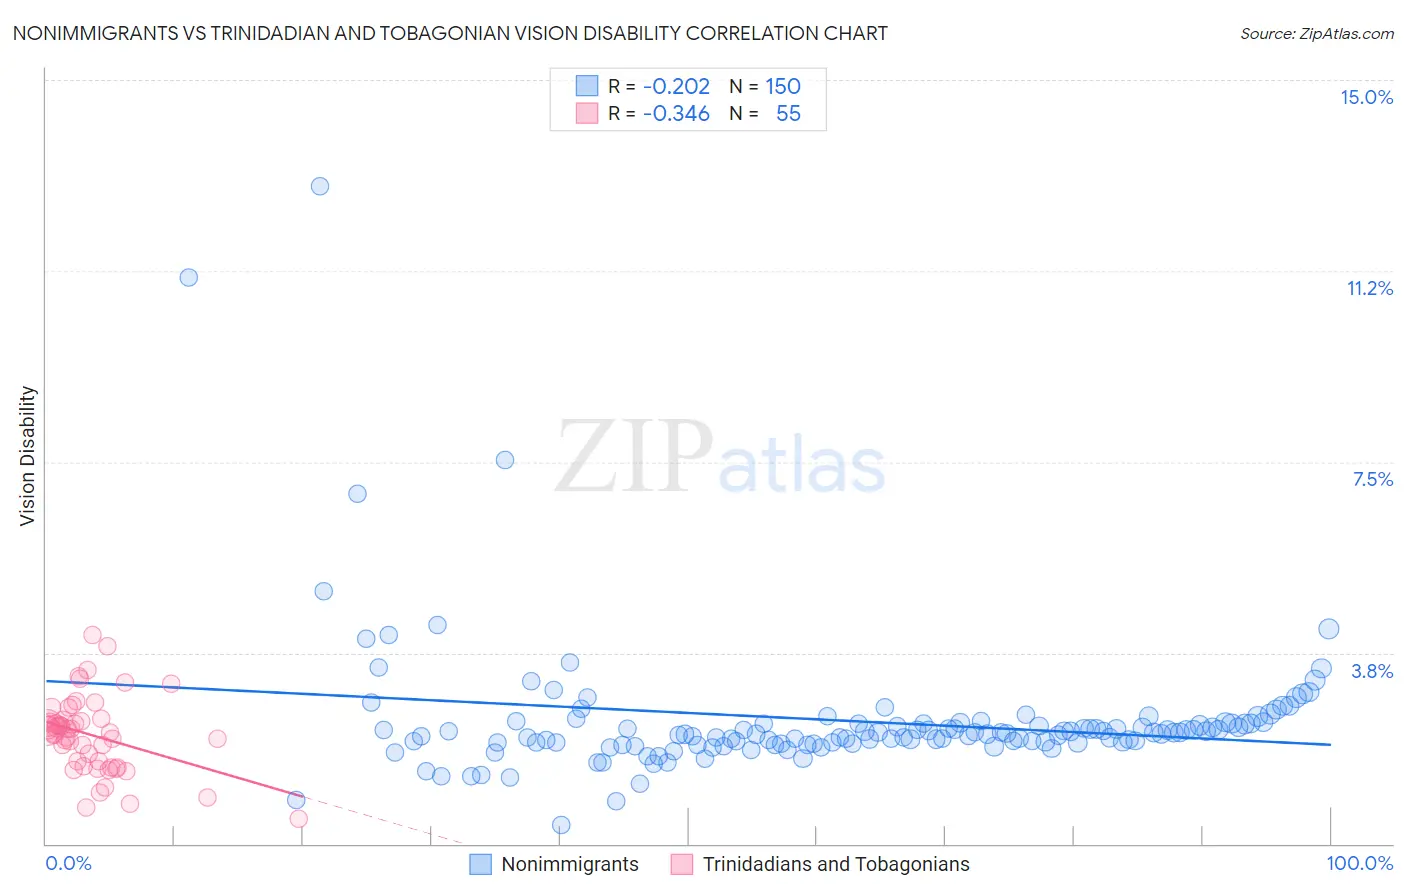
Nonimmigrants vs Trinidadian and Tobagonian Vision Disability Correlation Chart
The statistical analysis conducted on geographies consisting of 581,859,538 people shows a weak negative correlation between the proportion of Nonimmigrants and percentage of population with vision disability in the United States with a correlation coefficient (R) of -0.202 and weighted average of 2.5%. Similarly, the statistical analysis conducted on geographies consisting of 219,745,653 people shows a mild negative correlation between the proportion of Trinidadians and Tobagonians and percentage of population with vision disability in the United States with a correlation coefficient (R) of -0.346 and weighted average of 2.2%, a difference of 10.3%.
Vision Disability Correlation Summary
| Measurement | Nonimmigrants | Trinidadian and Tobagonian |
| Minimum | 0.37% | 0.49% |
| Maximum | 12.9% | 4.1% |
| Range | 12.5% | 3.6% |
| Mean | 2.4% | 2.1% |
| Median | 2.2% | 2.2% |
| Interquartile 25% (IQ1) | 2.0% | 1.5% |
| Interquartile 75% (IQ3) | 2.4% | 2.4% |
| Interquartile Range (IQR) | 0.38% | 0.92% |
| Standard Deviation (Sample) | 1.4% | 0.75% |
| Standard Deviation (Population) | 1.4% | 0.74% |
Similar Demographics by Vision Disability
Demographics Similar to Nonimmigrants by Vision Disability
In terms of vision disability, the demographic groups most similar to Nonimmigrants are Immigrants from Cuba (2.5%, a difference of 0.14%), French American Indian (2.5%, a difference of 0.41%), Honduran (2.5%, a difference of 0.43%), Immigrants from Honduras (2.5%, a difference of 0.53%), and Sioux (2.5%, a difference of 0.57%).
| Demographics | Rating | Rank | Vision Disability |
| Immigrants | Caribbean | 0.0 /100 | #282 | Tragic 2.5% |
| Puget Sound Salish | 0.0 /100 | #283 | Tragic 2.5% |
| Yakama | 0.0 /100 | #284 | Tragic 2.5% |
| Immigrants | Central America | 0.0 /100 | #285 | Tragic 2.5% |
| Sioux | 0.0 /100 | #286 | Tragic 2.5% |
| Hondurans | 0.0 /100 | #287 | Tragic 2.5% |
| French American Indians | 0.0 /100 | #288 | Tragic 2.5% |
| Immigrants | Nonimmigrants | 0.0 /100 | #289 | Tragic 2.5% |
| Immigrants | Cuba | 0.0 /100 | #290 | Tragic 2.5% |
| Immigrants | Honduras | 0.0 /100 | #291 | Tragic 2.5% |
| Crow | 0.0 /100 | #292 | Tragic 2.5% |
| Yaqui | 0.0 /100 | #293 | Tragic 2.5% |
| Ottawa | 0.0 /100 | #294 | Tragic 2.5% |
| Delaware | 0.0 /100 | #295 | Tragic 2.5% |
| Immigrants | Mexico | 0.0 /100 | #296 | Tragic 2.5% |
Demographics Similar to Trinidadians and Tobagonians by Vision Disability
In terms of vision disability, the demographic groups most similar to Trinidadians and Tobagonians are Immigrants from Ghana (2.2%, a difference of 0.13%), Bermudan (2.2%, a difference of 0.14%), Nigerian (2.3%, a difference of 0.21%), Indonesian (2.2%, a difference of 0.23%), and Immigrants from Trinidad and Tobago (2.3%, a difference of 0.50%).
| Demographics | Rating | Rank | Vision Disability |
| Immigrants | Nigeria | 13.5 /100 | #207 | Poor 2.2% |
| Germans | 13.4 /100 | #208 | Poor 2.2% |
| Immigrants | Brazil | 13.1 /100 | #209 | Poor 2.2% |
| Immigrants | Uruguay | 11.5 /100 | #210 | Poor 2.2% |
| Indonesians | 9.5 /100 | #211 | Tragic 2.2% |
| Bermudans | 9.0 /100 | #212 | Tragic 2.2% |
| Immigrants | Ghana | 8.9 /100 | #213 | Tragic 2.2% |
| Trinidadians and Tobagonians | 8.2 /100 | #214 | Tragic 2.2% |
| Nigerians | 7.2 /100 | #215 | Tragic 2.3% |
| Immigrants | Trinidad and Tobago | 6.1 /100 | #216 | Tragic 2.3% |
| Barbadians | 5.1 /100 | #217 | Tragic 2.3% |
| Portuguese | 4.9 /100 | #218 | Tragic 2.3% |
| Ecuadorians | 4.6 /100 | #219 | Tragic 2.3% |
| Guamanians/Chamorros | 3.9 /100 | #220 | Tragic 2.3% |
| French Canadians | 3.9 /100 | #221 | Tragic 2.3% |