Arab vs Trinidadian and Tobagonian Family Households
COMPARE
Arab
Trinidadian and Tobagonian
Family Households
Family Households Comparison
Arabs
Trinidadians and Tobagonians
64.1%
FAMILY HOUSEHOLDS
24.5/ 100
METRIC RATING
191st/ 347
METRIC RANK
63.6%
FAMILY HOUSEHOLDS
4.1/ 100
METRIC RATING
227th/ 347
METRIC RANK
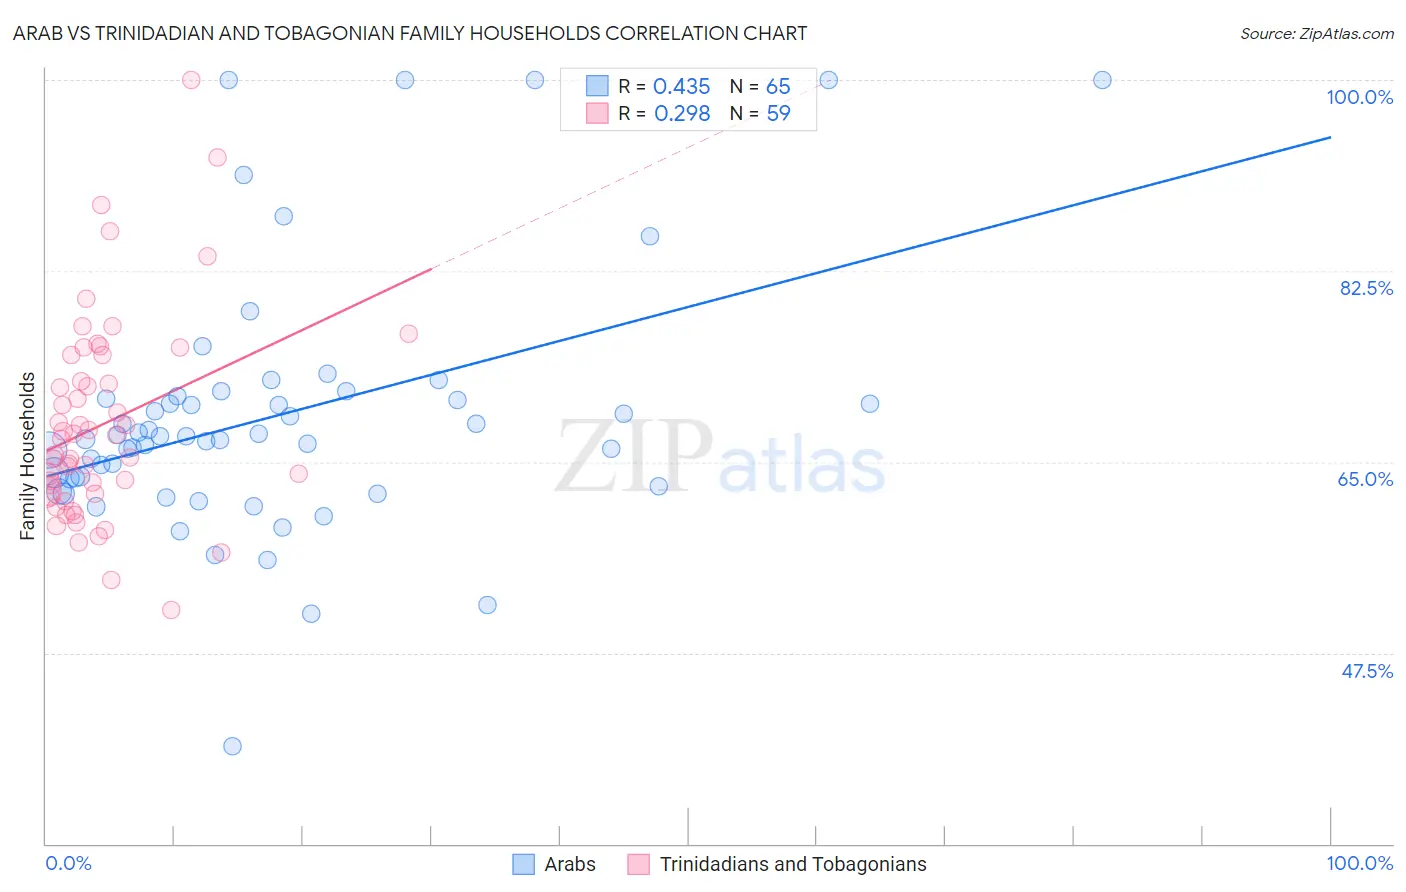
Arab vs Trinidadian and Tobagonian Family Households Correlation Chart
The statistical analysis conducted on geographies consisting of 486,389,490 people shows a moderate positive correlation between the proportion of Arabs and percentage of family households in the United States with a correlation coefficient (R) of 0.435 and weighted average of 64.1%. Similarly, the statistical analysis conducted on geographies consisting of 219,716,618 people shows a weak positive correlation between the proportion of Trinidadians and Tobagonians and percentage of family households in the United States with a correlation coefficient (R) of 0.298 and weighted average of 63.6%, a difference of 0.69%.
Family Households Correlation Summary
| Measurement | Arab | Trinidadian and Tobagonian |
| Minimum | 38.9% | 51.4% |
| Maximum | 100.0% | 100.0% |
| Range | 61.1% | 48.6% |
| Mean | 69.2% | 68.4% |
| Median | 67.3% | 67.1% |
| Interquartile 25% (IQ1) | 63.1% | 62.1% |
| Interquartile 75% (IQ3) | 70.9% | 74.7% |
| Interquartile Range (IQR) | 7.8% | 12.7% |
| Standard Deviation (Sample) | 11.8% | 9.3% |
| Standard Deviation (Population) | 11.7% | 9.2% |
Similar Demographics by Family Households
Demographics Similar to Arabs by Family Households
In terms of family households, the demographic groups most similar to Arabs are Zimbabwean (64.1%, a difference of 0.0%), Lithuanian (64.0%, a difference of 0.010%), French (64.0%, a difference of 0.010%), Immigrants from Western Asia (64.1%, a difference of 0.020%), and Paraguayan (64.1%, a difference of 0.040%).
| Demographics | Rating | Rank | Family Households |
| Puerto Ricans | 33.4 /100 | #184 | Fair 64.2% |
| Immigrants | Iran | 30.4 /100 | #185 | Fair 64.1% |
| Spanish Americans | 30.1 /100 | #186 | Fair 64.1% |
| Northern Europeans | 28.2 /100 | #187 | Fair 64.1% |
| Paraguayans | 26.7 /100 | #188 | Fair 64.1% |
| Immigrants | Western Asia | 25.3 /100 | #189 | Fair 64.1% |
| Zimbabweans | 24.7 /100 | #190 | Fair 64.1% |
| Arabs | 24.5 /100 | #191 | Fair 64.1% |
| Lithuanians | 23.8 /100 | #192 | Fair 64.0% |
| French | 23.7 /100 | #193 | Fair 64.0% |
| Paiute | 22.2 /100 | #194 | Fair 64.0% |
| Immigrants | North America | 20.0 /100 | #195 | Poor 64.0% |
| Immigrants | Canada | 19.2 /100 | #196 | Poor 64.0% |
| Seminole | 18.9 /100 | #197 | Poor 64.0% |
| Poles | 18.9 /100 | #198 | Poor 64.0% |
Demographics Similar to Trinidadians and Tobagonians by Family Households
In terms of family households, the demographic groups most similar to Trinidadians and Tobagonians are Immigrants from Bahamas (63.6%, a difference of 0.010%), Immigrants from Hungary (63.6%, a difference of 0.020%), Turkish (63.6%, a difference of 0.030%), Blackfeet (63.6%, a difference of 0.050%), and Bulgarian (63.6%, a difference of 0.070%).
| Demographics | Rating | Rank | Family Households |
| Immigrants | Europe | 6.4 /100 | #220 | Tragic 63.7% |
| Immigrants | South Africa | 5.9 /100 | #221 | Tragic 63.7% |
| Immigrants | Belarus | 5.5 /100 | #222 | Tragic 63.7% |
| French Canadians | 5.4 /100 | #223 | Tragic 63.7% |
| Turks | 4.5 /100 | #224 | Tragic 63.6% |
| Immigrants | Hungary | 4.3 /100 | #225 | Tragic 63.6% |
| Immigrants | Bahamas | 4.2 /100 | #226 | Tragic 63.6% |
| Trinidadians and Tobagonians | 4.1 /100 | #227 | Tragic 63.6% |
| Blackfeet | 3.6 /100 | #228 | Tragic 63.6% |
| Bulgarians | 3.4 /100 | #229 | Tragic 63.6% |
| Immigrants | Brazil | 3.0 /100 | #230 | Tragic 63.6% |
| Immigrants | Greece | 2.9 /100 | #231 | Tragic 63.5% |
| Immigrants | Northern Africa | 2.6 /100 | #232 | Tragic 63.5% |
| Immigrants | Armenia | 2.6 /100 | #233 | Tragic 63.5% |
| Finns | 2.3 /100 | #234 | Tragic 63.5% |