Nonimmigrants vs Mexican American Indian Family Households
COMPARE
Nonimmigrants
Mexican American Indian
Family Households
Family Households Comparison
Nonimmigrants
Mexican American Indians
64.8%
FAMILY HOUSEHOLDS
90.1/ 100
METRIC RATING
131st/ 347
METRIC RANK
67.0%
FAMILY HOUSEHOLDS
100.0/ 100
METRIC RATING
38th/ 347
METRIC RANK
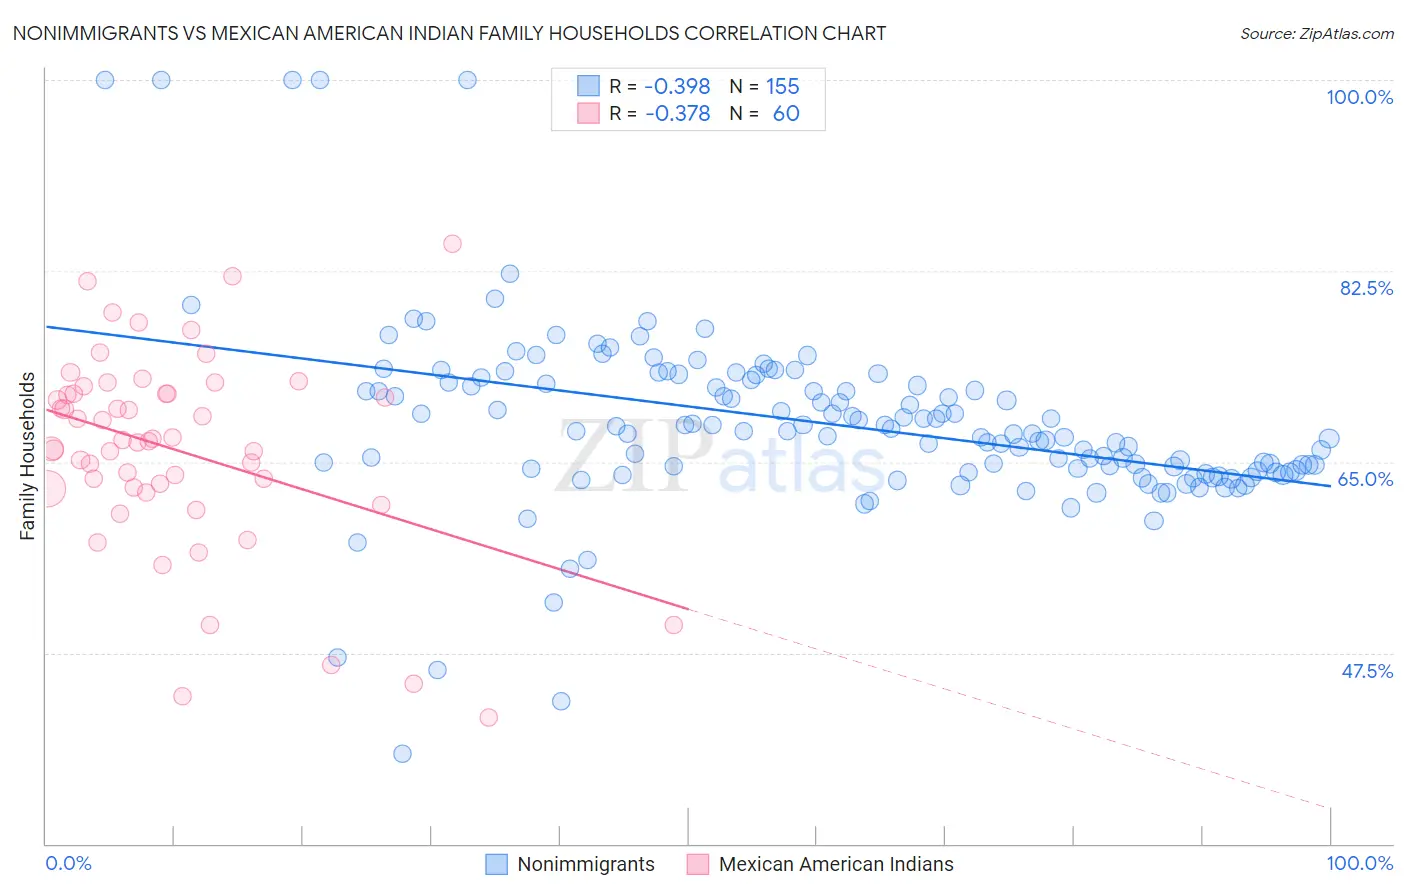
Nonimmigrants vs Mexican American Indian Family Households Correlation Chart
The statistical analysis conducted on geographies consisting of 584,651,779 people shows a mild negative correlation between the proportion of Nonimmigrants and percentage of family households in the United States with a correlation coefficient (R) of -0.398 and weighted average of 64.8%. Similarly, the statistical analysis conducted on geographies consisting of 317,495,580 people shows a mild negative correlation between the proportion of Mexican American Indians and percentage of family households in the United States with a correlation coefficient (R) of -0.378 and weighted average of 67.0%, a difference of 3.5%.
Family Households Correlation Summary
| Measurement | Nonimmigrants | Mexican American Indian |
| Minimum | 38.2% | 41.6% |
| Maximum | 100.0% | 85.0% |
| Range | 61.8% | 43.4% |
| Mean | 68.5% | 66.1% |
| Median | 67.8% | 67.0% |
| Interquartile 25% (IQ1) | 64.2% | 62.6% |
| Interquartile 75% (IQ3) | 72.3% | 71.3% |
| Interquartile Range (IQR) | 8.1% | 8.6% |
| Standard Deviation (Sample) | 8.6% | 9.1% |
| Standard Deviation (Population) | 8.6% | 9.0% |
Similar Demographics by Family Households
Demographics Similar to Nonimmigrants by Family Households
In terms of family households, the demographic groups most similar to Nonimmigrants are Immigrants from Italy (64.8%, a difference of 0.010%), Cajun (64.8%, a difference of 0.020%), Belizean (64.8%, a difference of 0.030%), Immigrants from Ecuador (64.8%, a difference of 0.050%), and Italian (64.8%, a difference of 0.070%).
| Demographics | Rating | Rank | Family Households |
| Immigrants | Argentina | 92.8 /100 | #124 | Exceptional 64.9% |
| Immigrants | Belize | 92.7 /100 | #125 | Exceptional 64.9% |
| Panamanians | 92.4 /100 | #126 | Exceptional 64.8% |
| Immigrants | Panama | 92.0 /100 | #127 | Exceptional 64.8% |
| Italians | 91.9 /100 | #128 | Exceptional 64.8% |
| Immigrants | Ecuador | 91.4 /100 | #129 | Exceptional 64.8% |
| Immigrants | Italy | 90.2 /100 | #130 | Exceptional 64.8% |
| Immigrants | Nonimmigrants | 90.1 /100 | #131 | Exceptional 64.8% |
| Cajuns | 89.4 /100 | #132 | Excellent 64.8% |
| Belizeans | 89.3 /100 | #133 | Excellent 64.8% |
| Greeks | 88.1 /100 | #134 | Excellent 64.7% |
| Maltese | 87.4 /100 | #135 | Excellent 64.7% |
| Immigrants | China | 86.6 /100 | #136 | Excellent 64.7% |
| Immigrants | Scotland | 86.4 /100 | #137 | Excellent 64.7% |
| Basques | 85.5 /100 | #138 | Excellent 64.7% |
Demographics Similar to Mexican American Indians by Family Households
In terms of family households, the demographic groups most similar to Mexican American Indians are Immigrants from El Salvador (67.0%, a difference of 0.020%), Tsimshian (67.1%, a difference of 0.10%), Peruvian (67.1%, a difference of 0.17%), Tohono O'odham (67.1%, a difference of 0.18%), and Salvadoran (67.2%, a difference of 0.23%).
| Demographics | Rating | Rank | Family Households |
| Immigrants | Latin America | 100.0 /100 | #31 | Exceptional 67.2% |
| Nepalese | 100.0 /100 | #32 | Exceptional 67.2% |
| Salvadorans | 100.0 /100 | #33 | Exceptional 67.2% |
| Thais | 100.0 /100 | #34 | Exceptional 67.2% |
| Tohono O'odham | 100.0 /100 | #35 | Exceptional 67.1% |
| Peruvians | 100.0 /100 | #36 | Exceptional 67.1% |
| Tsimshian | 100.0 /100 | #37 | Exceptional 67.1% |
| Mexican American Indians | 100.0 /100 | #38 | Exceptional 67.0% |
| Immigrants | El Salvador | 100.0 /100 | #39 | Exceptional 67.0% |
| Guamanians/Chamorros | 100.0 /100 | #40 | Exceptional 66.6% |
| Immigrants | Bolivia | 100.0 /100 | #41 | Exceptional 66.6% |
| Menominee | 100.0 /100 | #42 | Exceptional 66.5% |
| Apache | 100.0 /100 | #43 | Exceptional 66.5% |
| Asians | 100.0 /100 | #44 | Exceptional 66.5% |
| Venezuelans | 100.0 /100 | #45 | Exceptional 66.5% |