Czech vs Trinidadian and Tobagonian Family Households
COMPARE
Czech
Trinidadian and Tobagonian
Family Households
Family Households Comparison
Czechs
Trinidadians and Tobagonians
64.5%
FAMILY HOUSEHOLDS
67.0/ 100
METRIC RATING
156th/ 347
METRIC RANK
63.6%
FAMILY HOUSEHOLDS
4.1/ 100
METRIC RATING
227th/ 347
METRIC RANK
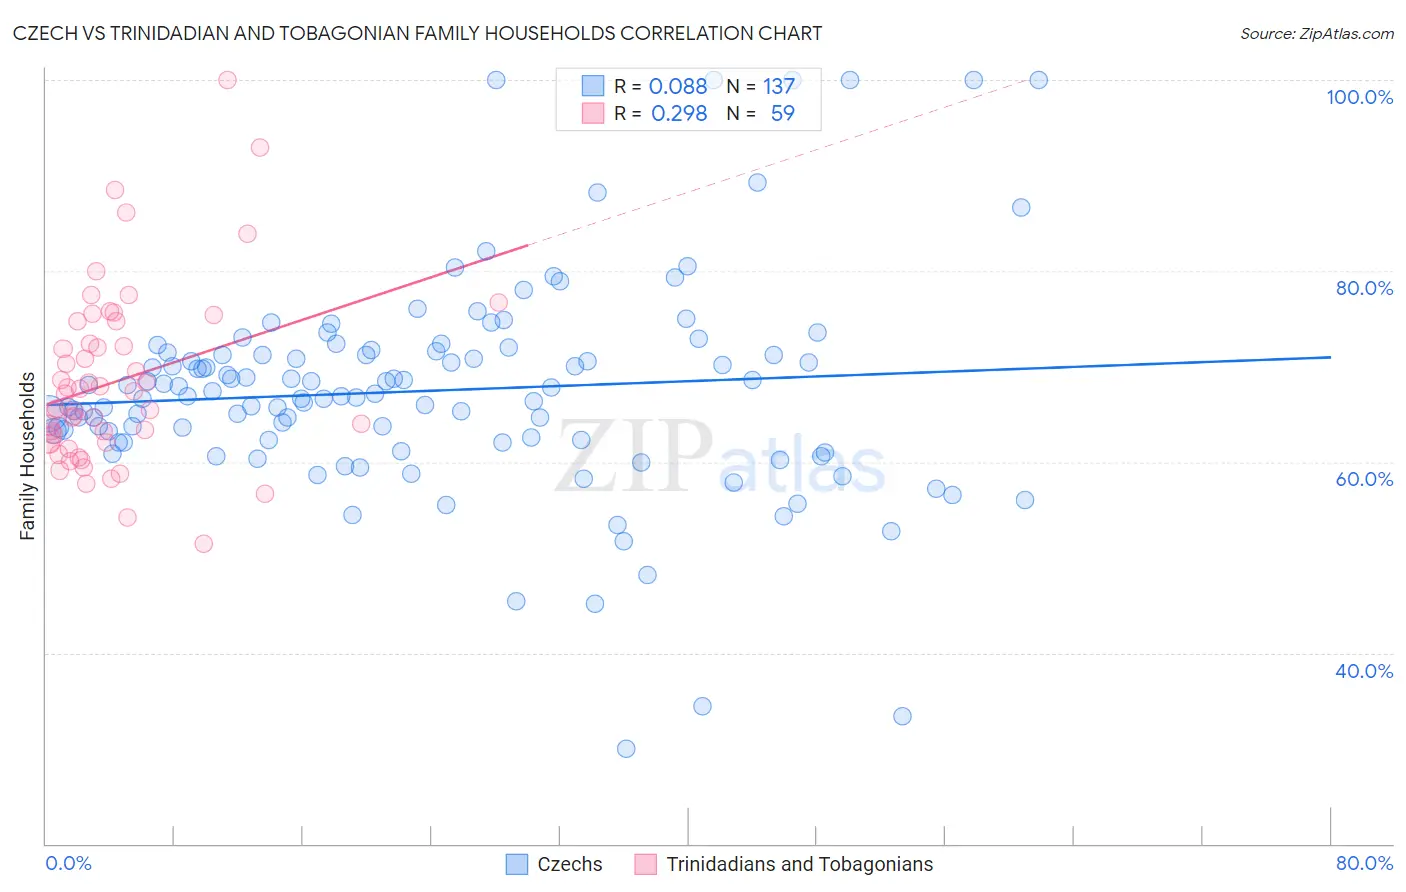
Czech vs Trinidadian and Tobagonian Family Households Correlation Chart
The statistical analysis conducted on geographies consisting of 484,475,433 people shows a slight positive correlation between the proportion of Czechs and percentage of family households in the United States with a correlation coefficient (R) of 0.088 and weighted average of 64.5%. Similarly, the statistical analysis conducted on geographies consisting of 219,716,618 people shows a weak positive correlation between the proportion of Trinidadians and Tobagonians and percentage of family households in the United States with a correlation coefficient (R) of 0.298 and weighted average of 63.6%, a difference of 1.3%.
Family Households Correlation Summary
| Measurement | Czech | Trinidadian and Tobagonian |
| Minimum | 29.9% | 51.4% |
| Maximum | 100.0% | 100.0% |
| Range | 70.1% | 48.6% |
| Mean | 67.4% | 68.4% |
| Median | 66.9% | 67.1% |
| Interquartile 25% (IQ1) | 62.2% | 62.1% |
| Interquartile 75% (IQ3) | 71.4% | 74.7% |
| Interquartile Range (IQR) | 9.2% | 12.7% |
| Standard Deviation (Sample) | 11.4% | 9.3% |
| Standard Deviation (Population) | 11.3% | 9.2% |
Similar Demographics by Family Households
Demographics Similar to Czechs by Family Households
In terms of family households, the demographic groups most similar to Czechs are Uruguayan (64.5%, a difference of 0.010%), Canadian (64.4%, a difference of 0.010%), Lebanese (64.4%, a difference of 0.010%), Austrian (64.5%, a difference of 0.020%), and German (64.4%, a difference of 0.020%).
| Demographics | Rating | Rank | Family Households |
| Sioux | 76.3 /100 | #149 | Good 64.6% |
| Romanians | 75.3 /100 | #150 | Good 64.5% |
| Syrians | 75.2 /100 | #151 | Good 64.5% |
| Scottish | 70.9 /100 | #152 | Good 64.5% |
| Swedes | 69.8 /100 | #153 | Good 64.5% |
| Austrians | 68.5 /100 | #154 | Good 64.5% |
| Uruguayans | 67.7 /100 | #155 | Good 64.5% |
| Czechs | 67.0 /100 | #156 | Good 64.5% |
| Canadians | 66.6 /100 | #157 | Good 64.4% |
| Lebanese | 66.4 /100 | #158 | Good 64.4% |
| Germans | 65.8 /100 | #159 | Good 64.4% |
| Immigrants | Moldova | 65.2 /100 | #160 | Good 64.4% |
| Immigrants | England | 62.6 /100 | #161 | Good 64.4% |
| British | 61.6 /100 | #162 | Good 64.4% |
| Chickasaw | 61.5 /100 | #163 | Good 64.4% |
Demographics Similar to Trinidadians and Tobagonians by Family Households
In terms of family households, the demographic groups most similar to Trinidadians and Tobagonians are Immigrants from Bahamas (63.6%, a difference of 0.010%), Immigrants from Hungary (63.6%, a difference of 0.020%), Turkish (63.6%, a difference of 0.030%), Blackfeet (63.6%, a difference of 0.050%), and Bulgarian (63.6%, a difference of 0.070%).
| Demographics | Rating | Rank | Family Households |
| Immigrants | Europe | 6.4 /100 | #220 | Tragic 63.7% |
| Immigrants | South Africa | 5.9 /100 | #221 | Tragic 63.7% |
| Immigrants | Belarus | 5.5 /100 | #222 | Tragic 63.7% |
| French Canadians | 5.4 /100 | #223 | Tragic 63.7% |
| Turks | 4.5 /100 | #224 | Tragic 63.6% |
| Immigrants | Hungary | 4.3 /100 | #225 | Tragic 63.6% |
| Immigrants | Bahamas | 4.2 /100 | #226 | Tragic 63.6% |
| Trinidadians and Tobagonians | 4.1 /100 | #227 | Tragic 63.6% |
| Blackfeet | 3.6 /100 | #228 | Tragic 63.6% |
| Bulgarians | 3.4 /100 | #229 | Tragic 63.6% |
| Immigrants | Brazil | 3.0 /100 | #230 | Tragic 63.6% |
| Immigrants | Greece | 2.9 /100 | #231 | Tragic 63.5% |
| Immigrants | Northern Africa | 2.6 /100 | #232 | Tragic 63.5% |
| Immigrants | Armenia | 2.6 /100 | #233 | Tragic 63.5% |
| Finns | 2.3 /100 | #234 | Tragic 63.5% |