Nonimmigrants vs Trinidadian and Tobagonian Bachelor's Degree
COMPARE
Nonimmigrants
Trinidadian and Tobagonian
Bachelor's Degree
Bachelor's Degree Comparison
Nonimmigrants
Trinidadians and Tobagonians
34.2%
BACHELOR'S DEGREE
1.8/ 100
METRIC RATING
242nd/ 347
METRIC RANK
35.7%
BACHELOR'S DEGREE
8.8/ 100
METRIC RATING
222nd/ 347
METRIC RANK
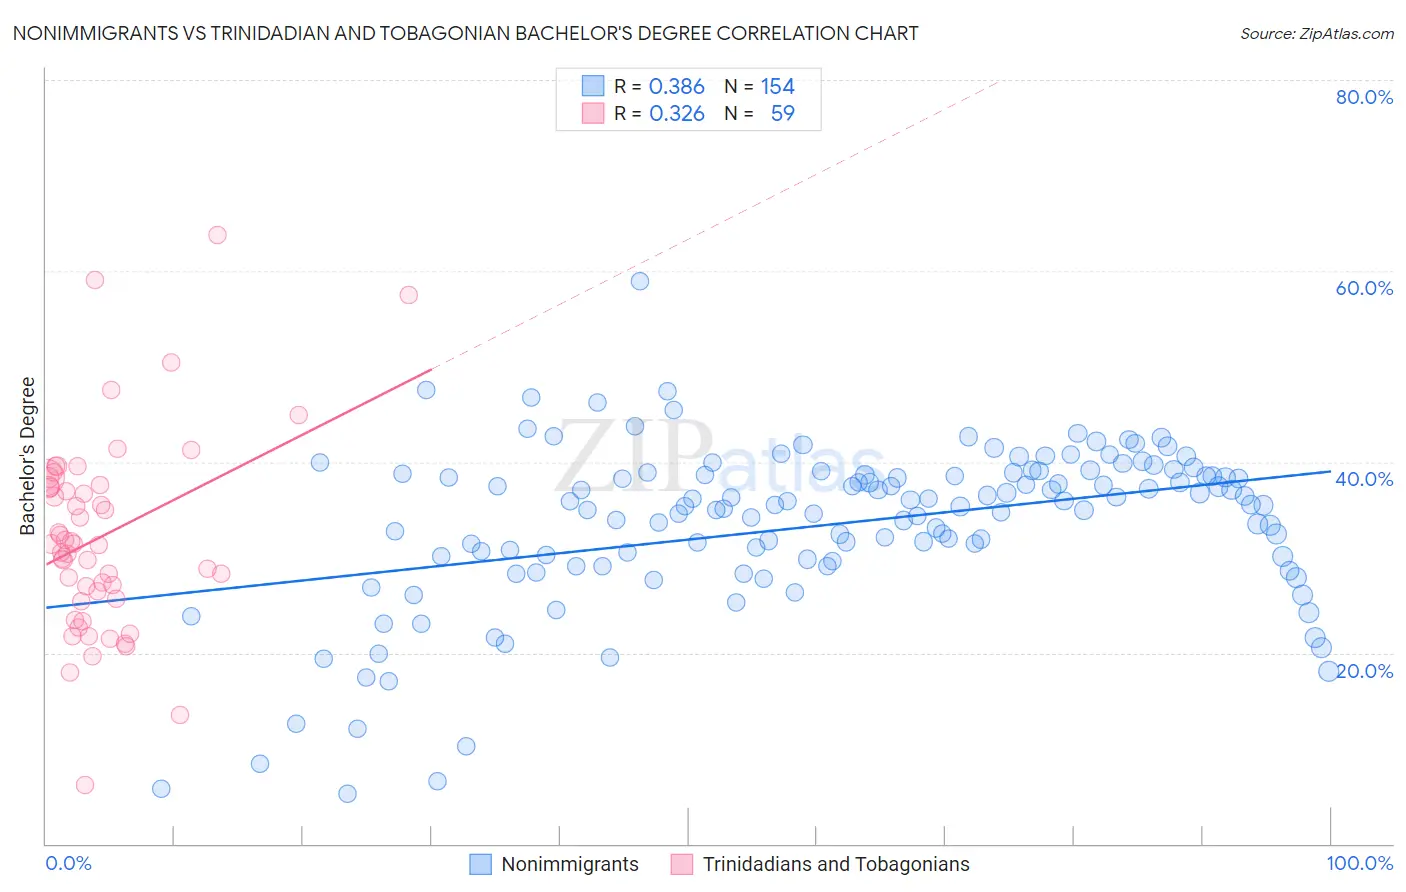
Nonimmigrants vs Trinidadian and Tobagonian Bachelor's Degree Correlation Chart
The statistical analysis conducted on geographies consisting of 584,797,512 people shows a mild positive correlation between the proportion of Nonimmigrants and percentage of population with at least bachelor's degree education in the United States with a correlation coefficient (R) of 0.386 and weighted average of 34.2%. Similarly, the statistical analysis conducted on geographies consisting of 219,852,585 people shows a mild positive correlation between the proportion of Trinidadians and Tobagonians and percentage of population with at least bachelor's degree education in the United States with a correlation coefficient (R) of 0.326 and weighted average of 35.7%, a difference of 4.4%.
Bachelor's Degree Correlation Summary
| Measurement | Nonimmigrants | Trinidadian and Tobagonian |
| Minimum | 5.2% | 6.2% |
| Maximum | 58.9% | 63.7% |
| Range | 53.7% | 57.5% |
| Mean | 33.4% | 32.2% |
| Median | 35.5% | 31.4% |
| Interquartile 25% (IQ1) | 29.8% | 25.6% |
| Interquartile 75% (IQ3) | 38.6% | 37.5% |
| Interquartile Range (IQR) | 8.9% | 11.9% |
| Standard Deviation (Sample) | 8.6% | 10.4% |
| Standard Deviation (Population) | 8.6% | 10.4% |
Demographics Similar to Nonimmigrants and Trinidadians and Tobagonians by Bachelor's Degree
In terms of bachelor's degree, the demographic groups most similar to Nonimmigrants are Immigrants from Cambodia (34.2%, a difference of 0.060%), Tongan (34.3%, a difference of 0.33%), British West Indian (34.5%, a difference of 0.87%), Guyanese (34.5%, a difference of 0.89%), and Tlingit-Haida (34.6%, a difference of 1.2%). Similarly, the demographic groups most similar to Trinidadians and Tobagonians are French Canadian (35.6%, a difference of 0.18%), Immigrants from Barbados (35.5%, a difference of 0.45%), Immigrants from Burma/Myanmar (35.5%, a difference of 0.52%), Portuguese (35.5%, a difference of 0.56%), and Ecuadorian (35.4%, a difference of 0.82%).
| Demographics | Rating | Rank | Bachelor's Degree |
| Trinidadians and Tobagonians | 8.8 /100 | #222 | Tragic 35.7% |
| French Canadians | 8.3 /100 | #223 | Tragic 35.6% |
| Immigrants | Barbados | 7.5 /100 | #224 | Tragic 35.5% |
| Immigrants | Burma/Myanmar | 7.3 /100 | #225 | Tragic 35.5% |
| Portuguese | 7.2 /100 | #226 | Tragic 35.5% |
| Ecuadorians | 6.6 /100 | #227 | Tragic 35.4% |
| Immigrants | Trinidad and Tobago | 6.0 /100 | #228 | Tragic 35.3% |
| Whites/Caucasians | 5.9 /100 | #229 | Tragic 35.3% |
| Immigrants | Grenada | 4.3 /100 | #230 | Tragic 35.0% |
| Immigrants | St. Vincent and the Grenadines | 4.3 /100 | #231 | Tragic 35.0% |
| Hmong | 3.4 /100 | #232 | Tragic 34.8% |
| Immigrants | Ecuador | 3.3 /100 | #233 | Tragic 34.7% |
| Guamanians/Chamorros | 3.0 /100 | #234 | Tragic 34.6% |
| Immigrants | West Indies | 2.9 /100 | #235 | Tragic 34.6% |
| Liberians | 2.8 /100 | #236 | Tragic 34.6% |
| Tlingit-Haida | 2.8 /100 | #237 | Tragic 34.6% |
| Guyanese | 2.5 /100 | #238 | Tragic 34.5% |
| British West Indians | 2.5 /100 | #239 | Tragic 34.5% |
| Tongans | 2.0 /100 | #240 | Tragic 34.3% |
| Immigrants | Cambodia | 1.9 /100 | #241 | Tragic 34.2% |
| Immigrants | Nonimmigrants | 1.8 /100 | #242 | Tragic 34.2% |