Yakama vs Trinidadian and Tobagonian Family Households
COMPARE
Yakama
Trinidadian and Tobagonian
Family Households
Family Households Comparison
Yakama
Trinidadians and Tobagonians
69.3%
FAMILY HOUSEHOLDS
100.0/ 100
METRIC RATING
4th/ 347
METRIC RANK
63.6%
FAMILY HOUSEHOLDS
4.1/ 100
METRIC RATING
227th/ 347
METRIC RANK
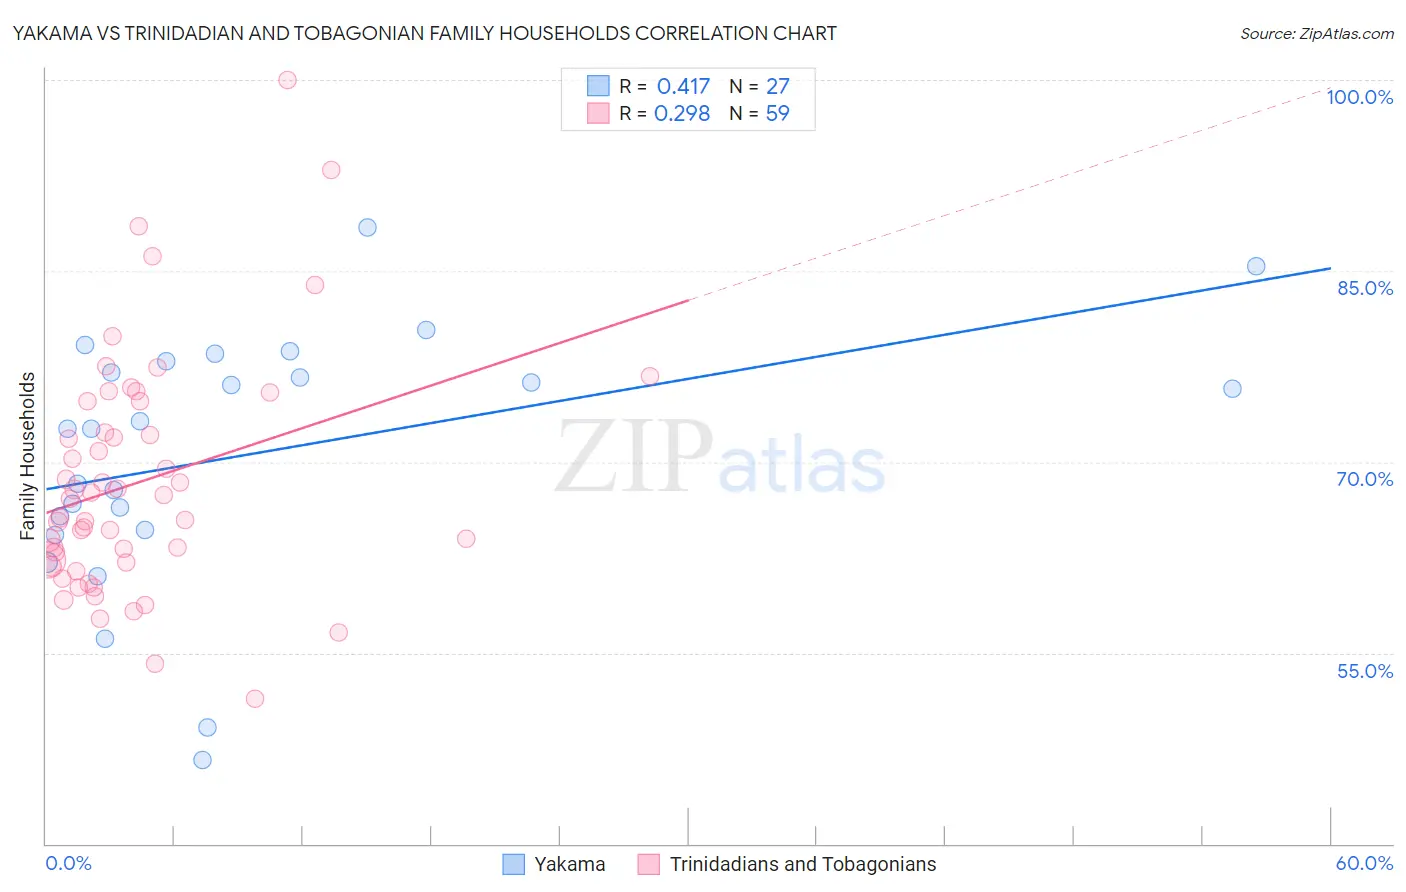
Yakama vs Trinidadian and Tobagonian Family Households Correlation Chart
The statistical analysis conducted on geographies consisting of 19,917,879 people shows a moderate positive correlation between the proportion of Yakama and percentage of family households in the United States with a correlation coefficient (R) of 0.417 and weighted average of 69.3%. Similarly, the statistical analysis conducted on geographies consisting of 219,716,618 people shows a weak positive correlation between the proportion of Trinidadians and Tobagonians and percentage of family households in the United States with a correlation coefficient (R) of 0.298 and weighted average of 63.6%, a difference of 8.9%.
Family Households Correlation Summary
| Measurement | Yakama | Trinidadian and Tobagonian |
| Minimum | 46.6% | 51.4% |
| Maximum | 88.5% | 100.0% |
| Range | 41.9% | 48.6% |
| Mean | 70.6% | 68.4% |
| Median | 72.6% | 67.1% |
| Interquartile 25% (IQ1) | 64.6% | 62.1% |
| Interquartile 75% (IQ3) | 77.9% | 74.7% |
| Interquartile Range (IQR) | 13.3% | 12.7% |
| Standard Deviation (Sample) | 10.1% | 9.3% |
| Standard Deviation (Population) | 9.9% | 9.2% |
Similar Demographics by Family Households
Demographics Similar to Yakama by Family Households
In terms of family households, the demographic groups most similar to Yakama are Yuman (69.3%, a difference of 0.030%), Immigrants from Mexico (69.1%, a difference of 0.26%), Tongan (69.6%, a difference of 0.44%), Mexican (69.0%, a difference of 0.47%), and Immigrants from Fiji (68.8%, a difference of 0.80%).
| Demographics | Rating | Rank | Family Households |
| Yup'ik | 100 /100 | #1 | Exceptional 72.4% |
| Spanish American Indians | 100.0 /100 | #2 | Exceptional 71.2% |
| Tongans | 100.0 /100 | #3 | Exceptional 69.6% |
| Yakama | 100.0 /100 | #4 | Exceptional 69.3% |
| Yuman | 100.0 /100 | #5 | Exceptional 69.3% |
| Immigrants | Mexico | 100.0 /100 | #6 | Exceptional 69.1% |
| Mexicans | 100.0 /100 | #7 | Exceptional 69.0% |
| Immigrants | Fiji | 100.0 /100 | #8 | Exceptional 68.8% |
| Native Hawaiians | 100.0 /100 | #9 | Exceptional 68.4% |
| Immigrants | Philippines | 100.0 /100 | #10 | Exceptional 68.3% |
| Immigrants | Central America | 100.0 /100 | #11 | Exceptional 68.3% |
| Koreans | 100.0 /100 | #12 | Exceptional 68.3% |
| Pueblo | 100.0 /100 | #13 | Exceptional 68.2% |
| Immigrants | Cuba | 100.0 /100 | #14 | Exceptional 68.2% |
| Assyrians/Chaldeans/Syriacs | 100.0 /100 | #15 | Exceptional 68.2% |
Demographics Similar to Trinidadians and Tobagonians by Family Households
In terms of family households, the demographic groups most similar to Trinidadians and Tobagonians are Immigrants from Bahamas (63.6%, a difference of 0.010%), Immigrants from Hungary (63.6%, a difference of 0.020%), Turkish (63.6%, a difference of 0.030%), Blackfeet (63.6%, a difference of 0.050%), and Bulgarian (63.6%, a difference of 0.070%).
| Demographics | Rating | Rank | Family Households |
| Immigrants | Europe | 6.4 /100 | #220 | Tragic 63.7% |
| Immigrants | South Africa | 5.9 /100 | #221 | Tragic 63.7% |
| Immigrants | Belarus | 5.5 /100 | #222 | Tragic 63.7% |
| French Canadians | 5.4 /100 | #223 | Tragic 63.7% |
| Turks | 4.5 /100 | #224 | Tragic 63.6% |
| Immigrants | Hungary | 4.3 /100 | #225 | Tragic 63.6% |
| Immigrants | Bahamas | 4.2 /100 | #226 | Tragic 63.6% |
| Trinidadians and Tobagonians | 4.1 /100 | #227 | Tragic 63.6% |
| Blackfeet | 3.6 /100 | #228 | Tragic 63.6% |
| Bulgarians | 3.4 /100 | #229 | Tragic 63.6% |
| Immigrants | Brazil | 3.0 /100 | #230 | Tragic 63.6% |
| Immigrants | Greece | 2.9 /100 | #231 | Tragic 63.5% |
| Immigrants | Northern Africa | 2.6 /100 | #232 | Tragic 63.5% |
| Immigrants | Armenia | 2.6 /100 | #233 | Tragic 63.5% |
| Finns | 2.3 /100 | #234 | Tragic 63.5% |