Alaska Native vs Liberian Births to Unmarried Women
COMPARE
Alaska Native
Liberian
Births to Unmarried Women
Births to Unmarried Women Comparison
Alaska Natives
Liberians
38.3%
BIRTHS TO UNMARRIED WOMEN
0.0/ 100
METRIC RATING
296th/ 347
METRIC RANK
37.4%
BIRTHS TO UNMARRIED WOMEN
0.0/ 100
METRIC RATING
282nd/ 347
METRIC RANK
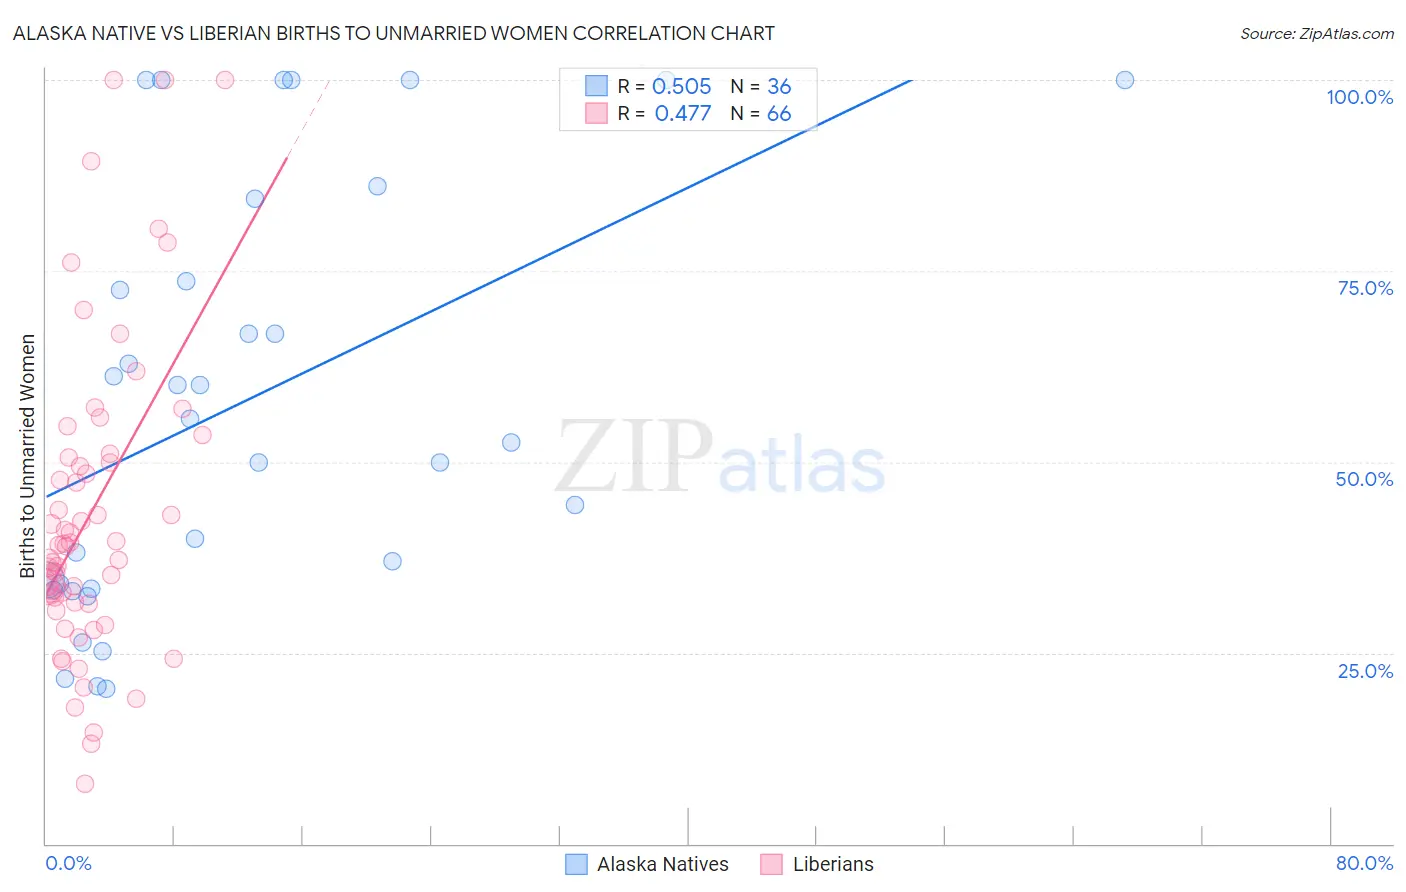
Alaska Native vs Liberian Births to Unmarried Women Correlation Chart
The statistical analysis conducted on geographies consisting of 75,658,541 people shows a substantial positive correlation between the proportion of Alaska Natives and percentage of births to unmarried women in the United States with a correlation coefficient (R) of 0.505 and weighted average of 38.3%. Similarly, the statistical analysis conducted on geographies consisting of 116,121,082 people shows a moderate positive correlation between the proportion of Liberians and percentage of births to unmarried women in the United States with a correlation coefficient (R) of 0.477 and weighted average of 37.4%, a difference of 2.4%.
Births to Unmarried Women Correlation Summary
| Measurement | Alaska Native | Liberian |
| Minimum | 20.3% | 7.8% |
| Maximum | 100.0% | 100.0% |
| Range | 79.7% | 92.2% |
| Mean | 57.7% | 43.2% |
| Median | 54.1% | 39.0% |
| Interquartile 25% (IQ1) | 33.8% | 31.6% |
| Interquartile 75% (IQ3) | 79.0% | 50.5% |
| Interquartile Range (IQR) | 45.3% | 18.9% |
| Standard Deviation (Sample) | 27.2% | 20.4% |
| Standard Deviation (Population) | 26.8% | 20.2% |
Demographics Similar to Alaska Natives and Liberians by Births to Unmarried Women
In terms of births to unmarried women, the demographic groups most similar to Alaska Natives are Iroquois (38.2%, a difference of 0.24%), Dutch West Indian (38.4%, a difference of 0.28%), Jamaican (38.5%, a difference of 0.48%), Spanish American (38.6%, a difference of 0.68%), and British West Indian (38.0%, a difference of 0.80%). Similarly, the demographic groups most similar to Liberians are Spanish American Indian (37.4%, a difference of 0.080%), Immigrants from Central America (37.4%, a difference of 0.14%), Immigrants from Belize (37.3%, a difference of 0.17%), Immigrants from St. Vincent and the Grenadines (37.3%, a difference of 0.18%), and Immigrants from Mexico (37.5%, a difference of 0.24%).
| Demographics | Rating | Rank | Births to Unmarried Women |
| West Indians | 0.1 /100 | #279 | Tragic 37.3% |
| Immigrants | St. Vincent and the Grenadines | 0.1 /100 | #280 | Tragic 37.3% |
| Immigrants | Belize | 0.1 /100 | #281 | Tragic 37.3% |
| Liberians | 0.0 /100 | #282 | Tragic 37.4% |
| Spanish American Indians | 0.0 /100 | #283 | Tragic 37.4% |
| Immigrants | Central America | 0.0 /100 | #284 | Tragic 37.4% |
| Immigrants | Mexico | 0.0 /100 | #285 | Tragic 37.5% |
| Immigrants | Guatemala | 0.0 /100 | #286 | Tragic 37.5% |
| Creek | 0.0 /100 | #287 | Tragic 37.6% |
| Immigrants | Liberia | 0.0 /100 | #288 | Tragic 37.6% |
| Alaskan Athabascans | 0.0 /100 | #289 | Tragic 37.7% |
| Hispanics or Latinos | 0.0 /100 | #290 | Tragic 37.8% |
| Seminole | 0.0 /100 | #291 | Tragic 37.9% |
| Blackfeet | 0.0 /100 | #292 | Tragic 37.9% |
| Immigrants | Nicaragua | 0.0 /100 | #293 | Tragic 38.0% |
| British West Indians | 0.0 /100 | #294 | Tragic 38.0% |
| Iroquois | 0.0 /100 | #295 | Tragic 38.2% |
| Alaska Natives | 0.0 /100 | #296 | Tragic 38.3% |
| Dutch West Indians | 0.0 /100 | #297 | Tragic 38.4% |
| Jamaicans | 0.0 /100 | #298 | Tragic 38.5% |
| Spanish Americans | 0.0 /100 | #299 | Tragic 38.6% |