Macedonian vs Laotian Births to Unmarried Women
COMPARE
Macedonian
Laotian
Births to Unmarried Women
Births to Unmarried Women Comparison
Macedonians
Laotians
27.9%
BIRTHS TO UNMARRIED WOMEN
99.4/ 100
METRIC RATING
51st/ 347
METRIC RANK
28.5%
BIRTHS TO UNMARRIED WOMEN
98.6/ 100
METRIC RATING
70th/ 347
METRIC RANK
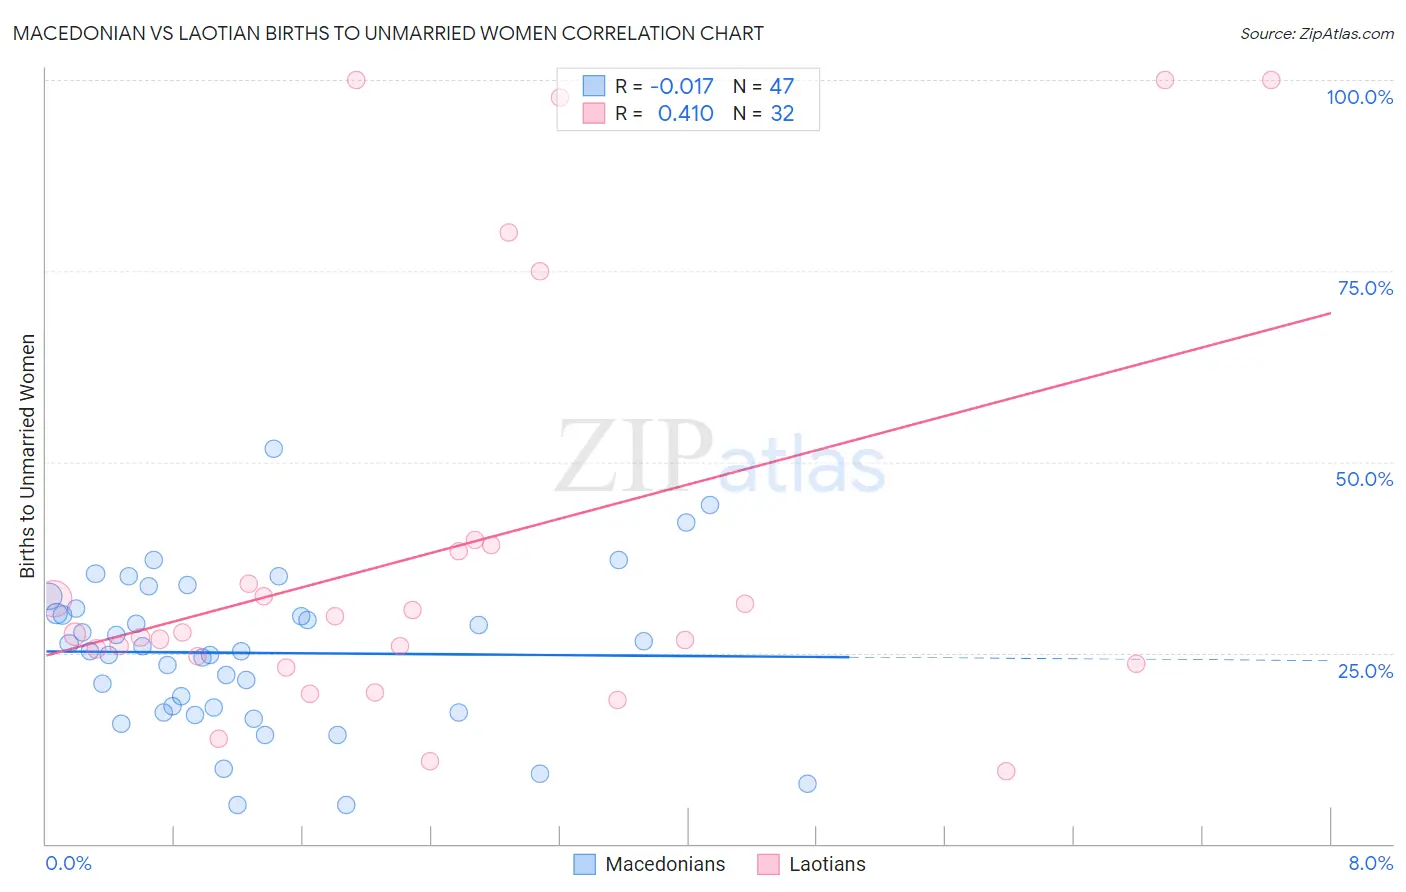
Macedonian vs Laotian Births to Unmarried Women Correlation Chart
The statistical analysis conducted on geographies consisting of 126,355,760 people shows no correlation between the proportion of Macedonians and percentage of births to unmarried women in the United States with a correlation coefficient (R) of -0.017 and weighted average of 27.9%. Similarly, the statistical analysis conducted on geographies consisting of 215,268,229 people shows a moderate positive correlation between the proportion of Laotians and percentage of births to unmarried women in the United States with a correlation coefficient (R) of 0.410 and weighted average of 28.5%, a difference of 2.2%.
Births to Unmarried Women Correlation Summary
| Measurement | Macedonian | Laotian |
| Minimum | 5.0% | 9.5% |
| Maximum | 51.8% | 100.0% |
| Range | 46.8% | 90.5% |
| Mean | 25.0% | 38.6% |
| Median | 25.3% | 27.5% |
| Interquartile 25% (IQ1) | 17.2% | 24.0% |
| Interquartile 75% (IQ3) | 30.8% | 38.7% |
| Interquartile Range (IQR) | 13.5% | 14.7% |
| Standard Deviation (Sample) | 10.1% | 27.4% |
| Standard Deviation (Population) | 10.0% | 27.0% |
Demographics Similar to Macedonians and Laotians by Births to Unmarried Women
In terms of births to unmarried women, the demographic groups most similar to Macedonians are Bhutanese (27.9%, a difference of 0.040%), Immigrants from Romania (27.9%, a difference of 0.050%), Afghan (27.9%, a difference of 0.12%), Maltese (27.8%, a difference of 0.13%), and Mongolian (27.9%, a difference of 0.16%). Similarly, the demographic groups most similar to Laotians are Bolivian (28.5%, a difference of 0.060%), Immigrants from Europe (28.4%, a difference of 0.10%), Palestinian (28.4%, a difference of 0.15%), Immigrants from Egypt (28.4%, a difference of 0.26%), and Immigrants from Czechoslovakia (28.4%, a difference of 0.28%).
| Demographics | Rating | Rank | Births to Unmarried Women |
| Maltese | 99.4 /100 | #50 | Exceptional 27.8% |
| Macedonians | 99.4 /100 | #51 | Exceptional 27.9% |
| Bhutanese | 99.4 /100 | #52 | Exceptional 27.9% |
| Immigrants | Romania | 99.4 /100 | #53 | Exceptional 27.9% |
| Afghans | 99.4 /100 | #54 | Exceptional 27.9% |
| Mongolians | 99.3 /100 | #55 | Exceptional 27.9% |
| Immigrants | Belgium | 99.3 /100 | #56 | Exceptional 28.0% |
| Russians | 99.2 /100 | #57 | Exceptional 28.0% |
| Immigrants | Albania | 99.2 /100 | #58 | Exceptional 28.0% |
| Immigrants | Kazakhstan | 99.1 /100 | #59 | Exceptional 28.1% |
| Immigrants | Turkey | 99.1 /100 | #60 | Exceptional 28.1% |
| Immigrants | North Macedonia | 99.1 /100 | #61 | Exceptional 28.1% |
| Egyptians | 99.0 /100 | #62 | Exceptional 28.2% |
| Immigrants | Serbia | 98.9 /100 | #63 | Exceptional 28.3% |
| Tongans | 98.8 /100 | #64 | Exceptional 28.4% |
| Immigrants | Czechoslovakia | 98.8 /100 | #65 | Exceptional 28.4% |
| Immigrants | Egypt | 98.8 /100 | #66 | Exceptional 28.4% |
| Palestinians | 98.7 /100 | #67 | Exceptional 28.4% |
| Immigrants | Europe | 98.7 /100 | #68 | Exceptional 28.4% |
| Bolivians | 98.7 /100 | #69 | Exceptional 28.5% |
| Laotians | 98.6 /100 | #70 | Exceptional 28.5% |