Native/Alaskan vs Laotian Unemployment Among Ages 55 to 59 years
COMPARE
Native/Alaskan
Laotian
Unemployment Among Ages 55 to 59 years
Unemployment Among Ages 55 to 59 years Comparison
Natives/Alaskans
Laotians
6.0%
UNEMPLOYMENT AMONG AGES 55 TO 59 YEARS
0.0/ 100
METRIC RATING
326th/ 347
METRIC RANK
4.8%
UNEMPLOYMENT AMONG AGES 55 TO 59 YEARS
68.2/ 100
METRIC RATING
152nd/ 347
METRIC RANK
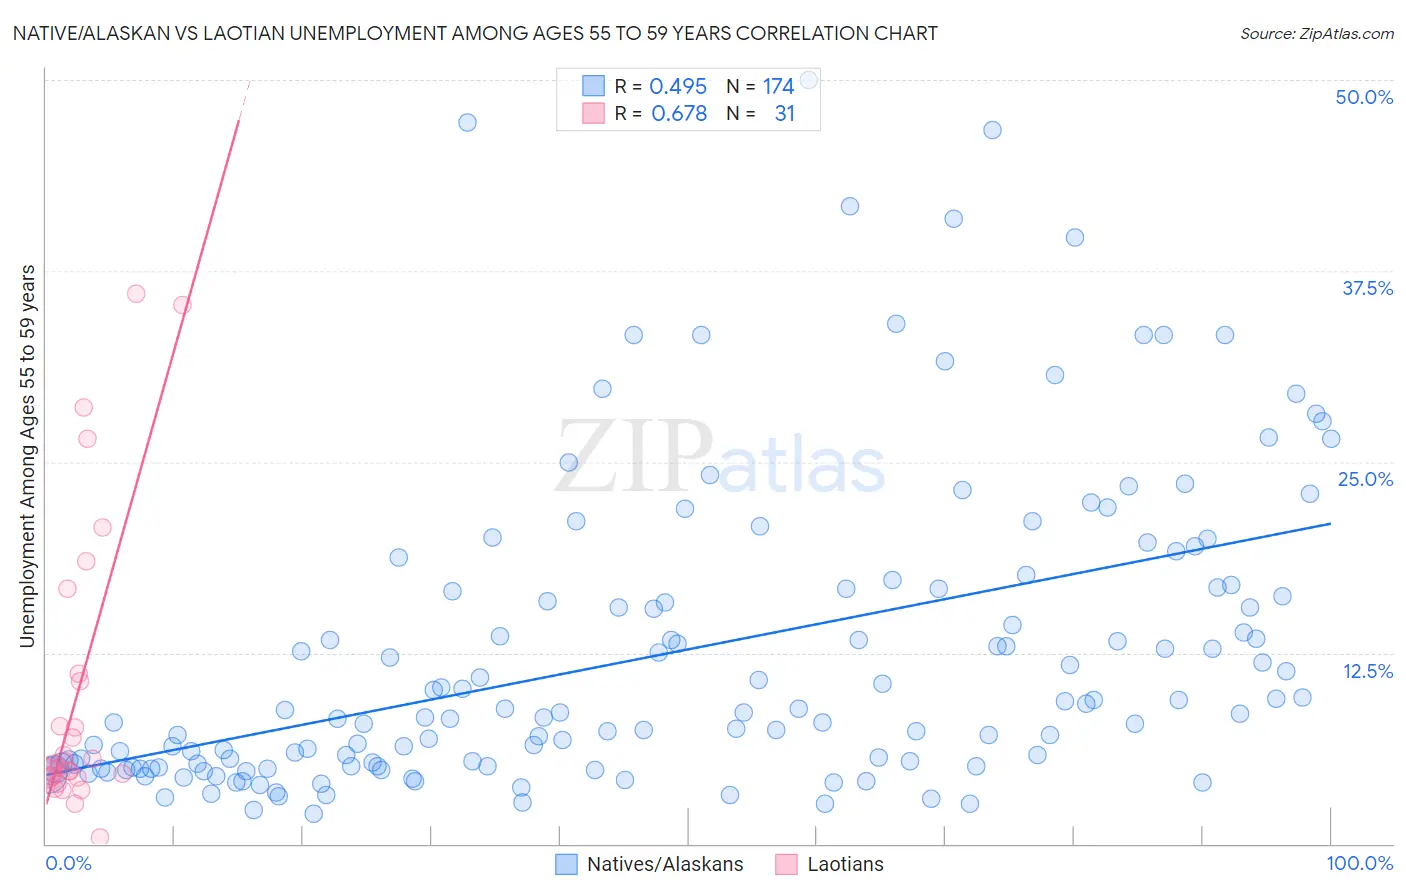
Native/Alaskan vs Laotian Unemployment Among Ages 55 to 59 years Correlation Chart
The statistical analysis conducted on geographies consisting of 455,461,585 people shows a moderate positive correlation between the proportion of Natives/Alaskans and unemployment rate among population between the ages 55 and 59 in the United States with a correlation coefficient (R) of 0.495 and weighted average of 6.0%. Similarly, the statistical analysis conducted on geographies consisting of 216,833,700 people shows a significant positive correlation between the proportion of Laotians and unemployment rate among population between the ages 55 and 59 in the United States with a correlation coefficient (R) of 0.678 and weighted average of 4.8%, a difference of 25.6%.
Unemployment Among Ages 55 to 59 years Correlation Summary
| Measurement | Native/Alaskan | Laotian |
| Minimum | 2.0% | 0.40% |
| Maximum | 50.0% | 36.0% |
| Range | 48.0% | 35.6% |
| Mean | 12.5% | 9.9% |
| Median | 8.5% | 5.2% |
| Interquartile 25% (IQ1) | 5.1% | 4.4% |
| Interquartile 75% (IQ3) | 16.7% | 11.1% |
| Interquartile Range (IQR) | 11.6% | 6.7% |
| Standard Deviation (Sample) | 10.1% | 9.7% |
| Standard Deviation (Population) | 10.0% | 9.6% |
Similar Demographics by Unemployment Among Ages 55 to 59 years
Demographics Similar to Natives/Alaskans by Unemployment Among Ages 55 to 59 years
In terms of unemployment among ages 55 to 59 years, the demographic groups most similar to Natives/Alaskans are Immigrants from Armenia (6.0%, a difference of 0.37%), Arapaho (6.1%, a difference of 0.88%), Yuman (6.1%, a difference of 2.1%), Vietnamese (5.9%, a difference of 2.1%), and Crow (5.9%, a difference of 2.2%).
| Demographics | Rating | Rank | Unemployment Among Ages 55 to 59 years |
| Kiowa | 0.0 /100 | #319 | Tragic 5.8% |
| Immigrants | Azores | 0.0 /100 | #320 | Tragic 5.8% |
| Chippewa | 0.0 /100 | #321 | Tragic 5.9% |
| Crow | 0.0 /100 | #322 | Tragic 5.9% |
| Immigrants | Bangladesh | 0.0 /100 | #323 | Tragic 5.9% |
| Vietnamese | 0.0 /100 | #324 | Tragic 5.9% |
| Immigrants | Armenia | 0.0 /100 | #325 | Tragic 6.0% |
| Natives/Alaskans | 0.0 /100 | #326 | Tragic 6.0% |
| Arapaho | 0.0 /100 | #327 | Tragic 6.1% |
| Yuman | 0.0 /100 | #328 | Tragic 6.1% |
| Dominicans | 0.0 /100 | #329 | Tragic 6.2% |
| Alaska Natives | 0.0 /100 | #330 | Tragic 6.2% |
| Immigrants | Dominican Republic | 0.0 /100 | #331 | Tragic 6.3% |
| Aleuts | 0.0 /100 | #332 | Tragic 6.4% |
| Pima | 0.0 /100 | #333 | Tragic 6.6% |
Demographics Similar to Laotians by Unemployment Among Ages 55 to 59 years
In terms of unemployment among ages 55 to 59 years, the demographic groups most similar to Laotians are Bahamian (4.8%, a difference of 0.020%), Immigrants from Uruguay (4.8%, a difference of 0.050%), Immigrants from Panama (4.8%, a difference of 0.070%), Immigrants from Northern Africa (4.8%, a difference of 0.080%), and Immigrants from North Macedonia (4.8%, a difference of 0.090%).
| Demographics | Rating | Rank | Unemployment Among Ages 55 to 59 years |
| Immigrants | Northern Europe | 77.5 /100 | #145 | Good 4.8% |
| Immigrants | South Eastern Asia | 77.4 /100 | #146 | Good 4.8% |
| Immigrants | Singapore | 76.6 /100 | #147 | Good 4.8% |
| Immigrants | Bahamas | 71.8 /100 | #148 | Good 4.8% |
| Immigrants | Lithuania | 70.8 /100 | #149 | Good 4.8% |
| Immigrants | Northern Africa | 69.8 /100 | #150 | Good 4.8% |
| Bahamians | 68.6 /100 | #151 | Good 4.8% |
| Laotians | 68.2 /100 | #152 | Good 4.8% |
| Immigrants | Uruguay | 67.2 /100 | #153 | Good 4.8% |
| Immigrants | Panama | 66.8 /100 | #154 | Good 4.8% |
| Immigrants | North Macedonia | 66.3 /100 | #155 | Good 4.8% |
| Italians | 66.2 /100 | #156 | Good 4.8% |
| Carpatho Rusyns | 66.0 /100 | #157 | Good 4.8% |
| Slovaks | 65.3 /100 | #158 | Good 4.8% |
| Immigrants | Nicaragua | 65.2 /100 | #159 | Good 4.8% |