Native/Alaskan vs Immigrants from Guyana Unemployment Among Ages 35 to 44 years
COMPARE
Native/Alaskan
Immigrants from Guyana
Unemployment Among Ages 35 to 44 years
Unemployment Among Ages 35 to 44 years Comparison
Natives/Alaskans
Immigrants from Guyana
7.3%
UNEMPLOYMENT AMONG AGES 35 TO 44 YEARS
0.0/ 100
METRIC RATING
332nd/ 347
METRIC RANK
6.0%
UNEMPLOYMENT AMONG AGES 35 TO 44 YEARS
0.0/ 100
METRIC RATING
312th/ 347
METRIC RANK
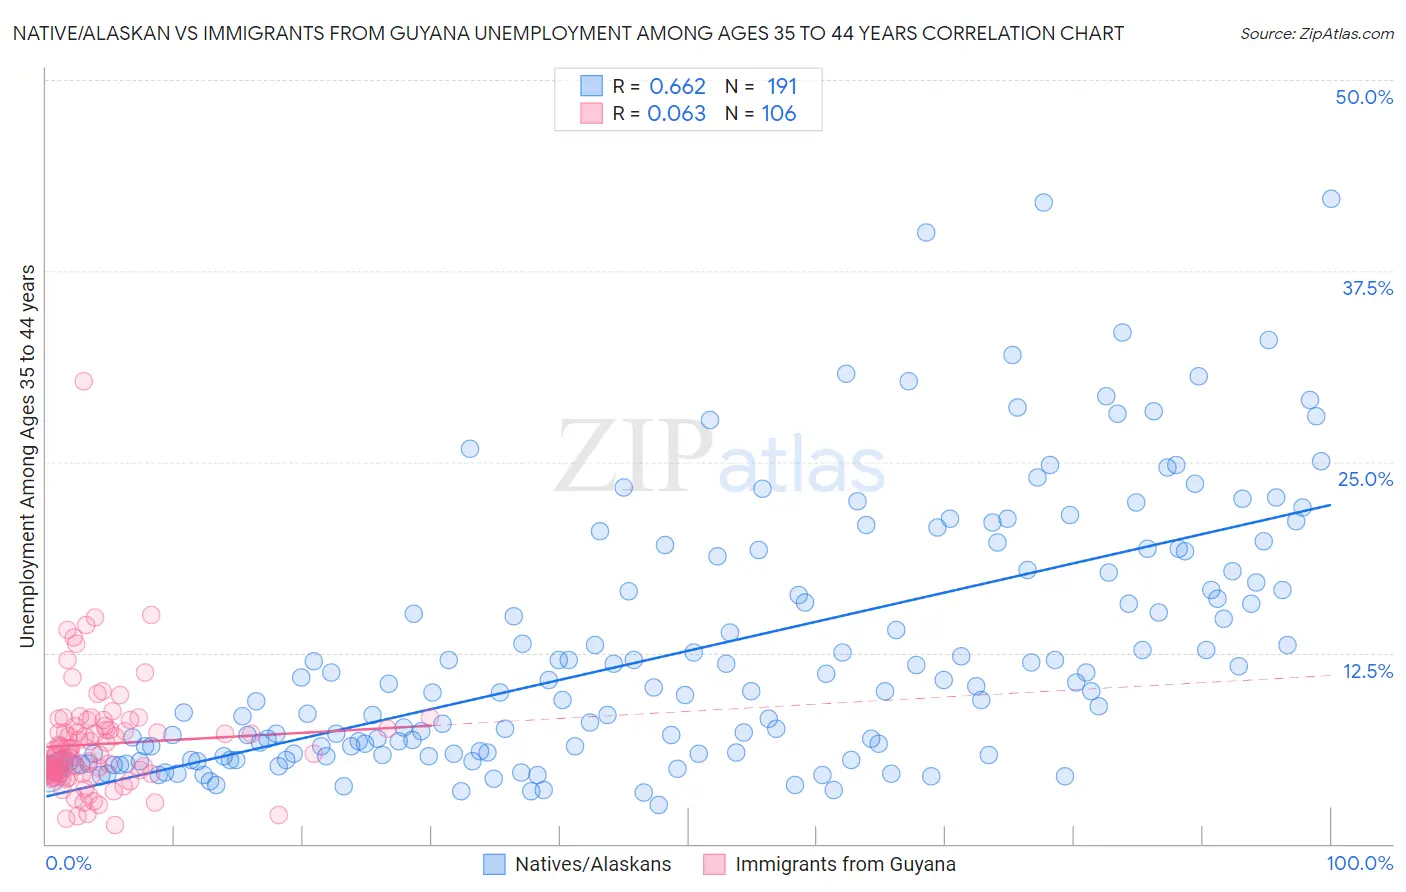
Native/Alaskan vs Immigrants from Guyana Unemployment Among Ages 35 to 44 years Correlation Chart
The statistical analysis conducted on geographies consisting of 490,779,782 people shows a significant positive correlation between the proportion of Natives/Alaskans and unemployment rate among population between the ages 35 and 44 in the United States with a correlation coefficient (R) of 0.662 and weighted average of 7.3%. Similarly, the statistical analysis conducted on geographies consisting of 182,093,178 people shows a slight positive correlation between the proportion of Immigrants from Guyana and unemployment rate among population between the ages 35 and 44 in the United States with a correlation coefficient (R) of 0.063 and weighted average of 6.0%, a difference of 21.6%.
Unemployment Among Ages 35 to 44 years Correlation Summary
| Measurement | Native/Alaskan | Immigrants from Guyana |
| Minimum | 2.5% | 1.2% |
| Maximum | 42.2% | 30.3% |
| Range | 39.7% | 29.1% |
| Mean | 12.6% | 6.5% |
| Median | 10.0% | 5.7% |
| Interquartile 25% (IQ1) | 5.8% | 4.6% |
| Interquartile 75% (IQ3) | 17.9% | 7.5% |
| Interquartile Range (IQR) | 12.0% | 2.9% |
| Standard Deviation (Sample) | 8.5% | 3.7% |
| Standard Deviation (Population) | 8.5% | 3.6% |
Demographics Similar to Natives/Alaskans and Immigrants from Guyana by Unemployment Among Ages 35 to 44 years
In terms of unemployment among ages 35 to 44 years, the demographic groups most similar to Natives/Alaskans are Pueblo (7.1%, a difference of 2.9%), Immigrants from Cabo Verde (6.9%, a difference of 5.5%), Paiute (6.9%, a difference of 5.5%), Shoshone (6.6%, a difference of 9.8%), and Cape Verdean (6.6%, a difference of 10.6%). Similarly, the demographic groups most similar to Immigrants from Guyana are British West Indian (6.0%, a difference of 0.12%), Immigrants from Dominica (6.0%, a difference of 0.49%), Black/African American (6.1%, a difference of 2.3%), Tsimshian (6.2%, a difference of 3.2%), and Immigrants from St. Vincent and the Grenadines (6.2%, a difference of 3.4%).
| Demographics | Rating | Rank | Unemployment Among Ages 35 to 44 years |
| Immigrants | Guyana | 0.0 /100 | #312 | Tragic 6.0% |
| British West Indians | 0.0 /100 | #313 | Tragic 6.0% |
| Immigrants | Dominica | 0.0 /100 | #314 | Tragic 6.0% |
| Blacks/African Americans | 0.0 /100 | #315 | Tragic 6.1% |
| Tsimshian | 0.0 /100 | #316 | Tragic 6.2% |
| Immigrants | St. Vincent and the Grenadines | 0.0 /100 | #317 | Tragic 6.2% |
| Colville | 0.0 /100 | #318 | Tragic 6.2% |
| Immigrants | Grenada | 0.0 /100 | #319 | Tragic 6.2% |
| Immigrants | Armenia | 0.0 /100 | #320 | Tragic 6.2% |
| Chippewa | 0.0 /100 | #321 | Tragic 6.2% |
| Immigrants | Dominican Republic | 0.0 /100 | #322 | Tragic 6.4% |
| Dominicans | 0.0 /100 | #323 | Tragic 6.4% |
| Menominee | 0.0 /100 | #324 | Tragic 6.5% |
| Immigrants | Yemen | 0.0 /100 | #325 | Tragic 6.6% |
| Alaska Natives | 0.0 /100 | #326 | Tragic 6.6% |
| Cape Verdeans | 0.0 /100 | #327 | Tragic 6.6% |
| Shoshone | 0.0 /100 | #328 | Tragic 6.6% |
| Paiute | 0.0 /100 | #329 | Tragic 6.9% |
| Immigrants | Cabo Verde | 0.0 /100 | #330 | Tragic 6.9% |
| Pueblo | 0.0 /100 | #331 | Tragic 7.1% |
| Natives/Alaskans | 0.0 /100 | #332 | Tragic 7.3% |