Vietnamese vs Immigrants from Guyana Births to Unmarried Women
COMPARE
Vietnamese
Immigrants from Guyana
Births to Unmarried Women
Births to Unmarried Women Comparison
Vietnamese
Immigrants from Guyana
30.2%
BIRTHS TO UNMARRIED WOMEN
87.7/ 100
METRIC RATING
125th/ 347
METRIC RANK
35.0%
BIRTHS TO UNMARRIED WOMEN
1.2/ 100
METRIC RATING
241st/ 347
METRIC RANK
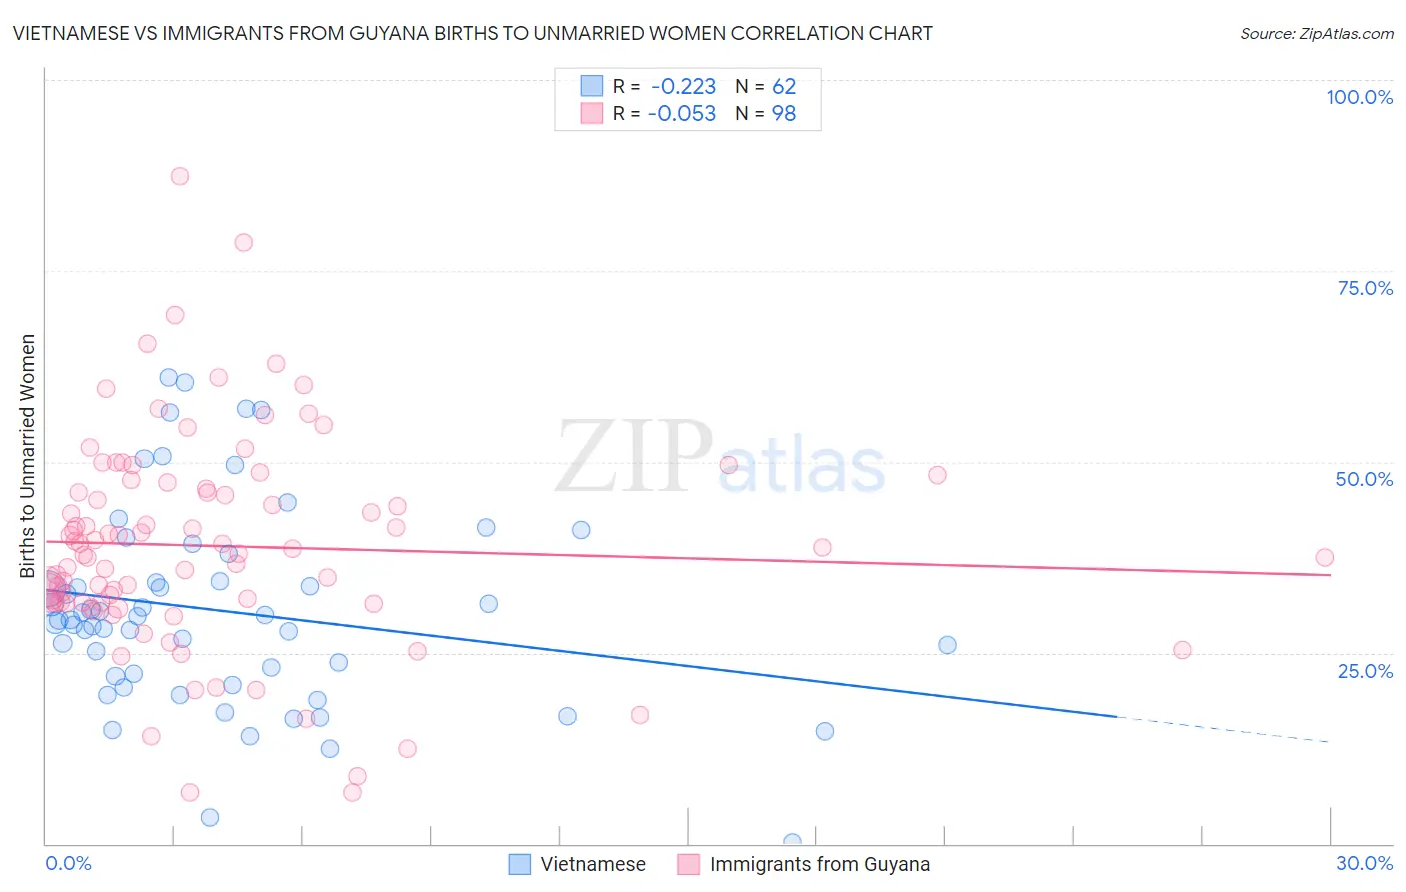
Vietnamese vs Immigrants from Guyana Births to Unmarried Women Correlation Chart
The statistical analysis conducted on geographies consisting of 164,695,989 people shows a weak negative correlation between the proportion of Vietnamese and percentage of births to unmarried women in the United States with a correlation coefficient (R) of -0.223 and weighted average of 30.2%. Similarly, the statistical analysis conducted on geographies consisting of 177,005,491 people shows a slight negative correlation between the proportion of Immigrants from Guyana and percentage of births to unmarried women in the United States with a correlation coefficient (R) of -0.053 and weighted average of 35.0%, a difference of 15.8%.
Births to Unmarried Women Correlation Summary
| Measurement | Vietnamese | Immigrants from Guyana |
| Minimum | 0.20% | 6.7% |
| Maximum | 61.1% | 87.4% |
| Range | 60.9% | 80.7% |
| Mean | 30.5% | 39.0% |
| Median | 29.3% | 38.4% |
| Interquartile 25% (IQ1) | 22.0% | 31.6% |
| Interquartile 75% (IQ3) | 34.3% | 46.5% |
| Interquartile Range (IQR) | 12.3% | 14.9% |
| Standard Deviation (Sample) | 13.0% | 14.0% |
| Standard Deviation (Population) | 12.9% | 14.0% |
Similar Demographics by Births to Unmarried Women
Demographics Similar to Vietnamese by Births to Unmarried Women
In terms of births to unmarried women, the demographic groups most similar to Vietnamese are Croatian (30.2%, a difference of 0.070%), Syrian (30.2%, a difference of 0.11%), European (30.2%, a difference of 0.12%), Chinese (30.2%, a difference of 0.14%), and Immigrants from Argentina (30.1%, a difference of 0.24%).
| Demographics | Rating | Rank | Births to Unmarried Women |
| Immigrants | Norway | 91.0 /100 | #118 | Exceptional 29.9% |
| Argentineans | 90.5 /100 | #119 | Exceptional 30.0% |
| Ugandans | 89.2 /100 | #120 | Excellent 30.1% |
| Koreans | 88.9 /100 | #121 | Excellent 30.1% |
| Immigrants | Argentina | 88.7 /100 | #122 | Excellent 30.1% |
| Syrians | 88.2 /100 | #123 | Excellent 30.2% |
| Croatians | 88.0 /100 | #124 | Excellent 30.2% |
| Vietnamese | 87.7 /100 | #125 | Excellent 30.2% |
| Europeans | 87.2 /100 | #126 | Excellent 30.2% |
| Chinese | 87.1 /100 | #127 | Excellent 30.2% |
| Icelanders | 86.0 /100 | #128 | Excellent 30.3% |
| Immigrants | Spain | 85.8 /100 | #129 | Excellent 30.3% |
| Immigrants | Bosnia and Herzegovina | 85.7 /100 | #130 | Excellent 30.3% |
| Immigrants | Zimbabwe | 85.7 /100 | #131 | Excellent 30.3% |
| New Zealanders | 85.5 /100 | #132 | Excellent 30.3% |
Demographics Similar to Immigrants from Guyana by Births to Unmarried Women
In terms of births to unmarried women, the demographic groups most similar to Immigrants from Guyana are Immigrants from Middle Africa (34.9%, a difference of 0.030%), Indonesian (35.0%, a difference of 0.10%), Sierra Leonean (34.9%, a difference of 0.28%), Immigrants from Cambodia (34.8%, a difference of 0.51%), and Marshallese (34.8%, a difference of 0.57%).
| Demographics | Rating | Rank | Births to Unmarried Women |
| Immigrants | Zaire | 2.3 /100 | #234 | Tragic 34.5% |
| Immigrants | Ghana | 2.2 /100 | #235 | Tragic 34.5% |
| Immigrants | Cameroon | 1.6 /100 | #236 | Tragic 34.7% |
| Marshallese | 1.6 /100 | #237 | Tragic 34.8% |
| Immigrants | Cambodia | 1.6 /100 | #238 | Tragic 34.8% |
| Sierra Leoneans | 1.4 /100 | #239 | Tragic 34.9% |
| Immigrants | Middle Africa | 1.2 /100 | #240 | Tragic 34.9% |
| Immigrants | Guyana | 1.2 /100 | #241 | Tragic 35.0% |
| Indonesians | 1.2 /100 | #242 | Tragic 35.0% |
| Japanese | 0.9 /100 | #243 | Tragic 35.2% |
| Guyanese | 0.9 /100 | #244 | Tragic 35.2% |
| Shoshone | 0.8 /100 | #245 | Tragic 35.3% |
| Nigerians | 0.7 /100 | #246 | Tragic 35.3% |
| Immigrants | Nigeria | 0.7 /100 | #247 | Tragic 35.4% |
| Immigrants | Nonimmigrants | 0.6 /100 | #248 | Tragic 35.5% |