Carpatho Rusyn vs Immigrants from Guyana Births to Unmarried Women
COMPARE
Carpatho Rusyn
Immigrants from Guyana
Births to Unmarried Women
Births to Unmarried Women Comparison
Carpatho Rusyns
Immigrants from Guyana
30.9%
BIRTHS TO UNMARRIED WOMEN
73.5/ 100
METRIC RATING
156th/ 347
METRIC RANK
35.0%
BIRTHS TO UNMARRIED WOMEN
1.2/ 100
METRIC RATING
241st/ 347
METRIC RANK
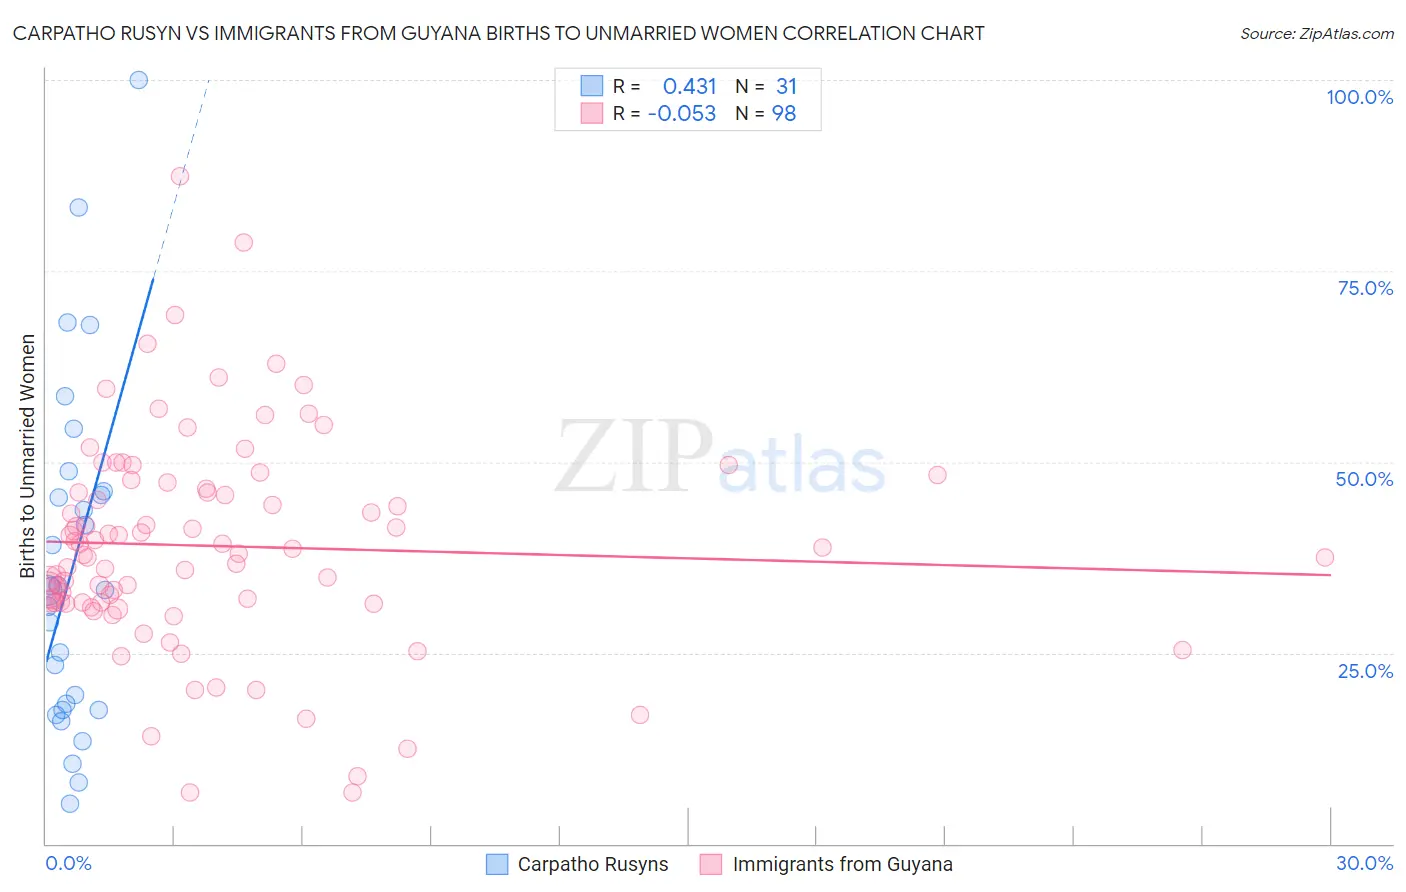
Carpatho Rusyn vs Immigrants from Guyana Births to Unmarried Women Correlation Chart
The statistical analysis conducted on geographies consisting of 56,982,210 people shows a moderate positive correlation between the proportion of Carpatho Rusyns and percentage of births to unmarried women in the United States with a correlation coefficient (R) of 0.431 and weighted average of 30.9%. Similarly, the statistical analysis conducted on geographies consisting of 177,005,491 people shows a slight negative correlation between the proportion of Immigrants from Guyana and percentage of births to unmarried women in the United States with a correlation coefficient (R) of -0.053 and weighted average of 35.0%, a difference of 13.1%.
Births to Unmarried Women Correlation Summary
| Measurement | Carpatho Rusyn | Immigrants from Guyana |
| Minimum | 5.2% | 6.7% |
| Maximum | 100.0% | 87.4% |
| Range | 94.8% | 80.7% |
| Mean | 36.4% | 39.0% |
| Median | 33.3% | 38.4% |
| Interquartile 25% (IQ1) | 17.5% | 31.6% |
| Interquartile 75% (IQ3) | 46.2% | 46.5% |
| Interquartile Range (IQR) | 28.7% | 14.9% |
| Standard Deviation (Sample) | 22.4% | 14.0% |
| Standard Deviation (Population) | 22.1% | 14.0% |
Similar Demographics by Births to Unmarried Women
Demographics Similar to Carpatho Rusyns by Births to Unmarried Women
In terms of births to unmarried women, the demographic groups most similar to Carpatho Rusyns are Immigrants from Bangladesh (30.9%, a difference of 0.050%), Immigrants from Eastern Africa (31.0%, a difference of 0.17%), Yugoslavian (30.8%, a difference of 0.20%), British (30.8%, a difference of 0.32%), and Polish (30.8%, a difference of 0.34%).
| Demographics | Rating | Rank | Births to Unmarried Women |
| Serbians | 78.8 /100 | #149 | Good 30.7% |
| Somalis | 77.8 /100 | #150 | Good 30.7% |
| Italians | 77.0 /100 | #151 | Good 30.8% |
| Poles | 76.2 /100 | #152 | Good 30.8% |
| British | 76.0 /100 | #153 | Good 30.8% |
| Yugoslavians | 75.1 /100 | #154 | Good 30.8% |
| Immigrants | Bangladesh | 73.9 /100 | #155 | Good 30.9% |
| Carpatho Rusyns | 73.5 /100 | #156 | Good 30.9% |
| Immigrants | Eastern Africa | 72.1 /100 | #157 | Good 31.0% |
| Austrians | 69.9 /100 | #158 | Good 31.0% |
| Immigrants | England | 69.4 /100 | #159 | Good 31.1% |
| Immigrants | Western Europe | 69.3 /100 | #160 | Good 31.1% |
| Immigrants | Southern Europe | 68.7 /100 | #161 | Good 31.1% |
| Slovenes | 65.9 /100 | #162 | Good 31.2% |
| Immigrants | Chile | 65.7 /100 | #163 | Good 31.2% |
Demographics Similar to Immigrants from Guyana by Births to Unmarried Women
In terms of births to unmarried women, the demographic groups most similar to Immigrants from Guyana are Immigrants from Middle Africa (34.9%, a difference of 0.030%), Indonesian (35.0%, a difference of 0.10%), Sierra Leonean (34.9%, a difference of 0.28%), Immigrants from Cambodia (34.8%, a difference of 0.51%), and Marshallese (34.8%, a difference of 0.57%).
| Demographics | Rating | Rank | Births to Unmarried Women |
| Immigrants | Zaire | 2.3 /100 | #234 | Tragic 34.5% |
| Immigrants | Ghana | 2.2 /100 | #235 | Tragic 34.5% |
| Immigrants | Cameroon | 1.6 /100 | #236 | Tragic 34.7% |
| Marshallese | 1.6 /100 | #237 | Tragic 34.8% |
| Immigrants | Cambodia | 1.6 /100 | #238 | Tragic 34.8% |
| Sierra Leoneans | 1.4 /100 | #239 | Tragic 34.9% |
| Immigrants | Middle Africa | 1.2 /100 | #240 | Tragic 34.9% |
| Immigrants | Guyana | 1.2 /100 | #241 | Tragic 35.0% |
| Indonesians | 1.2 /100 | #242 | Tragic 35.0% |
| Japanese | 0.9 /100 | #243 | Tragic 35.2% |
| Guyanese | 0.9 /100 | #244 | Tragic 35.2% |
| Shoshone | 0.8 /100 | #245 | Tragic 35.3% |
| Nigerians | 0.7 /100 | #246 | Tragic 35.3% |
| Immigrants | Nigeria | 0.7 /100 | #247 | Tragic 35.4% |
| Immigrants | Nonimmigrants | 0.6 /100 | #248 | Tragic 35.5% |