Native/Alaskan vs European Divorced or Separated
COMPARE
Native/Alaskan
European
Divorced or Separated
Divorced or Separated Comparison
Natives/Alaskans
Europeans
13.0%
DIVORCED OR SEPARATED
0.0/ 100
METRIC RATING
297th/ 347
METRIC RANK
12.2%
DIVORCED OR SEPARATED
15.4/ 100
METRIC RATING
215th/ 347
METRIC RANK
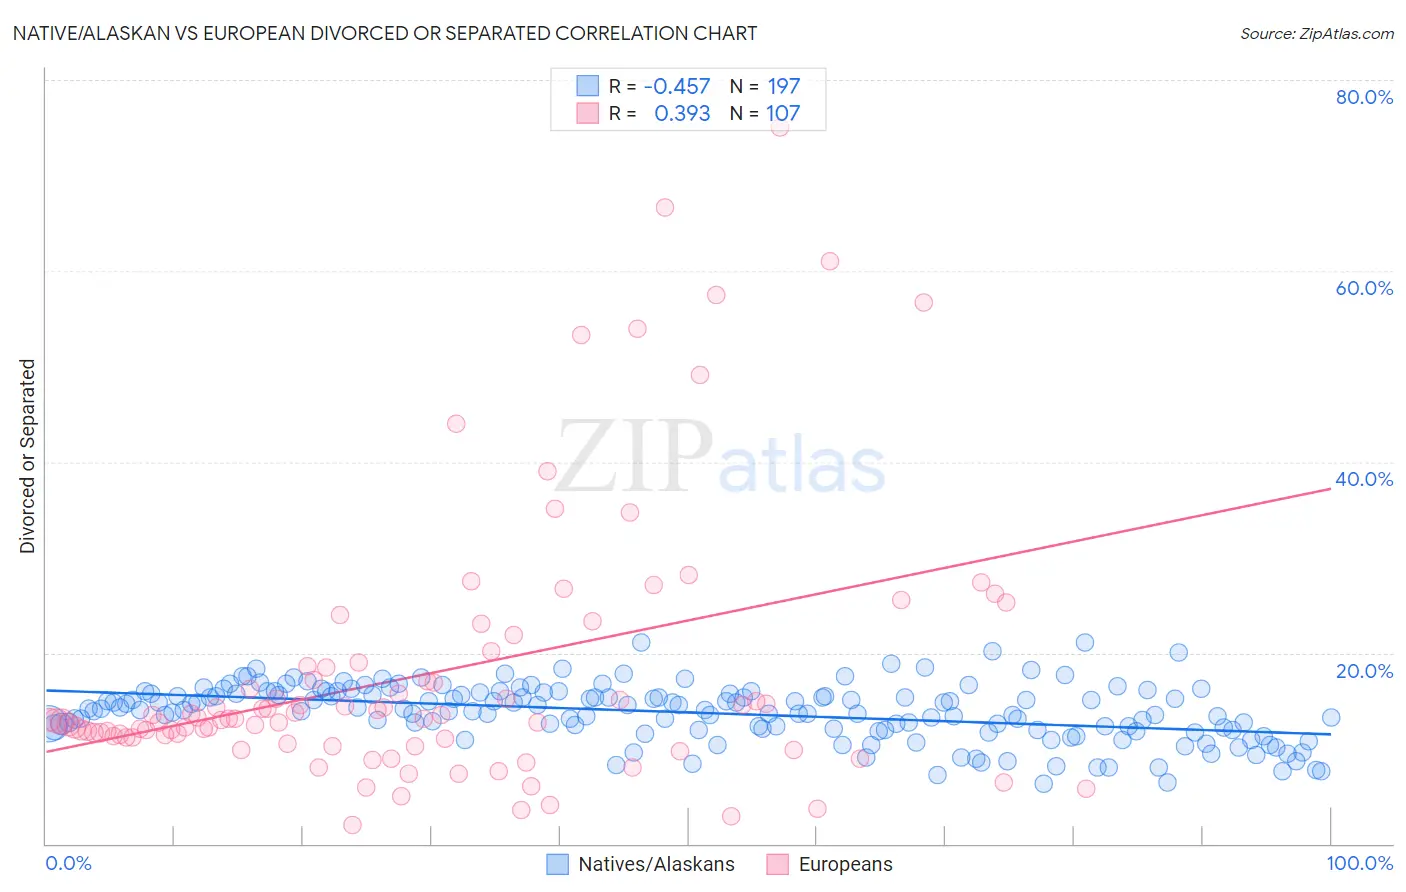
Native/Alaskan vs European Divorced or Separated Correlation Chart
The statistical analysis conducted on geographies consisting of 512,782,555 people shows a moderate negative correlation between the proportion of Natives/Alaskans and percentage of population currently divorced or separated in the United States with a correlation coefficient (R) of -0.457 and weighted average of 13.0%. Similarly, the statistical analysis conducted on geographies consisting of 561,401,989 people shows a mild positive correlation between the proportion of Europeans and percentage of population currently divorced or separated in the United States with a correlation coefficient (R) of 0.393 and weighted average of 12.2%, a difference of 6.4%.
Divorced or Separated Correlation Summary
| Measurement | Native/Alaskan | European |
| Minimum | 6.3% | 1.9% |
| Maximum | 21.1% | 75.0% |
| Range | 14.8% | 73.1% |
| Mean | 13.8% | 17.8% |
| Median | 14.1% | 13.0% |
| Interquartile 25% (IQ1) | 12.0% | 11.1% |
| Interquartile 75% (IQ3) | 15.8% | 18.6% |
| Interquartile Range (IQR) | 3.8% | 7.4% |
| Standard Deviation (Sample) | 2.9% | 14.0% |
| Standard Deviation (Population) | 2.9% | 14.0% |
Similar Demographics by Divorced or Separated
Demographics Similar to Natives/Alaskans by Divorced or Separated
In terms of divorced or separated, the demographic groups most similar to Natives/Alaskans are Nicaraguan (13.0%, a difference of 0.050%), Venezuelan (13.0%, a difference of 0.070%), Immigrants from Jamaica (13.0%, a difference of 0.10%), Celtic (13.0%, a difference of 0.47%), and Apache (12.9%, a difference of 0.60%).
| Demographics | Rating | Rank | Divorced or Separated |
| Pima | 0.0 /100 | #290 | Tragic 12.9% |
| Immigrants | Honduras | 0.0 /100 | #291 | Tragic 12.9% |
| Scotch-Irish | 0.0 /100 | #292 | Tragic 12.9% |
| Jamaicans | 0.0 /100 | #293 | Tragic 12.9% |
| Apache | 0.0 /100 | #294 | Tragic 12.9% |
| Celtics | 0.0 /100 | #295 | Tragic 13.0% |
| Nicaraguans | 0.0 /100 | #296 | Tragic 13.0% |
| Natives/Alaskans | 0.0 /100 | #297 | Tragic 13.0% |
| Venezuelans | 0.0 /100 | #298 | Tragic 13.0% |
| Immigrants | Jamaica | 0.0 /100 | #299 | Tragic 13.0% |
| Immigrants | Cabo Verde | 0.0 /100 | #300 | Tragic 13.1% |
| Alaskan Athabascans | 0.0 /100 | #301 | Tragic 13.1% |
| Immigrants | Venezuela | 0.0 /100 | #302 | Tragic 13.1% |
| Cape Verdeans | 0.0 /100 | #303 | Tragic 13.1% |
| Hopi | 0.0 /100 | #304 | Tragic 13.2% |
Demographics Similar to Europeans by Divorced or Separated
In terms of divorced or separated, the demographic groups most similar to Europeans are Immigrants from South America (12.2%, a difference of 0.0%), Immigrants from Argentina (12.2%, a difference of 0.010%), Immigrants from Eastern Africa (12.2%, a difference of 0.050%), Northern European (12.2%, a difference of 0.050%), and Immigrants from Kenya (12.2%, a difference of 0.070%).
| Demographics | Rating | Rank | Divorced or Separated |
| Immigrants | Ghana | 18.8 /100 | #208 | Poor 12.2% |
| Immigrants | Trinidad and Tobago | 17.8 /100 | #209 | Poor 12.2% |
| Slavs | 17.0 /100 | #210 | Poor 12.2% |
| Trinidadians and Tobagonians | 16.6 /100 | #211 | Poor 12.2% |
| Immigrants | Kenya | 16.5 /100 | #212 | Poor 12.2% |
| Immigrants | Eastern Africa | 16.2 /100 | #213 | Poor 12.2% |
| Immigrants | Argentina | 15.5 /100 | #214 | Poor 12.2% |
| Europeans | 15.4 /100 | #215 | Poor 12.2% |
| Immigrants | South America | 15.4 /100 | #216 | Poor 12.2% |
| Northern Europeans | 14.7 /100 | #217 | Poor 12.2% |
| Slovenes | 13.2 /100 | #218 | Poor 12.3% |
| Czechoslovakians | 11.7 /100 | #219 | Poor 12.3% |
| British | 11.6 /100 | #220 | Poor 12.3% |
| Guamanians/Chamorros | 11.3 /100 | #221 | Poor 12.3% |
| Bangladeshis | 10.5 /100 | #222 | Poor 12.3% |