Native/Alaskan vs Assyrian/Chaldean/Syriac Divorced or Separated
COMPARE
Native/Alaskan
Assyrian/Chaldean/Syriac
Divorced or Separated
Divorced or Separated Comparison
Natives/Alaskans
Assyrians/Chaldeans/Syriacs
13.0%
DIVORCED OR SEPARATED
0.0/ 100
METRIC RATING
297th/ 347
METRIC RANK
10.6%
DIVORCED OR SEPARATED
100.0/ 100
METRIC RATING
14th/ 347
METRIC RANK
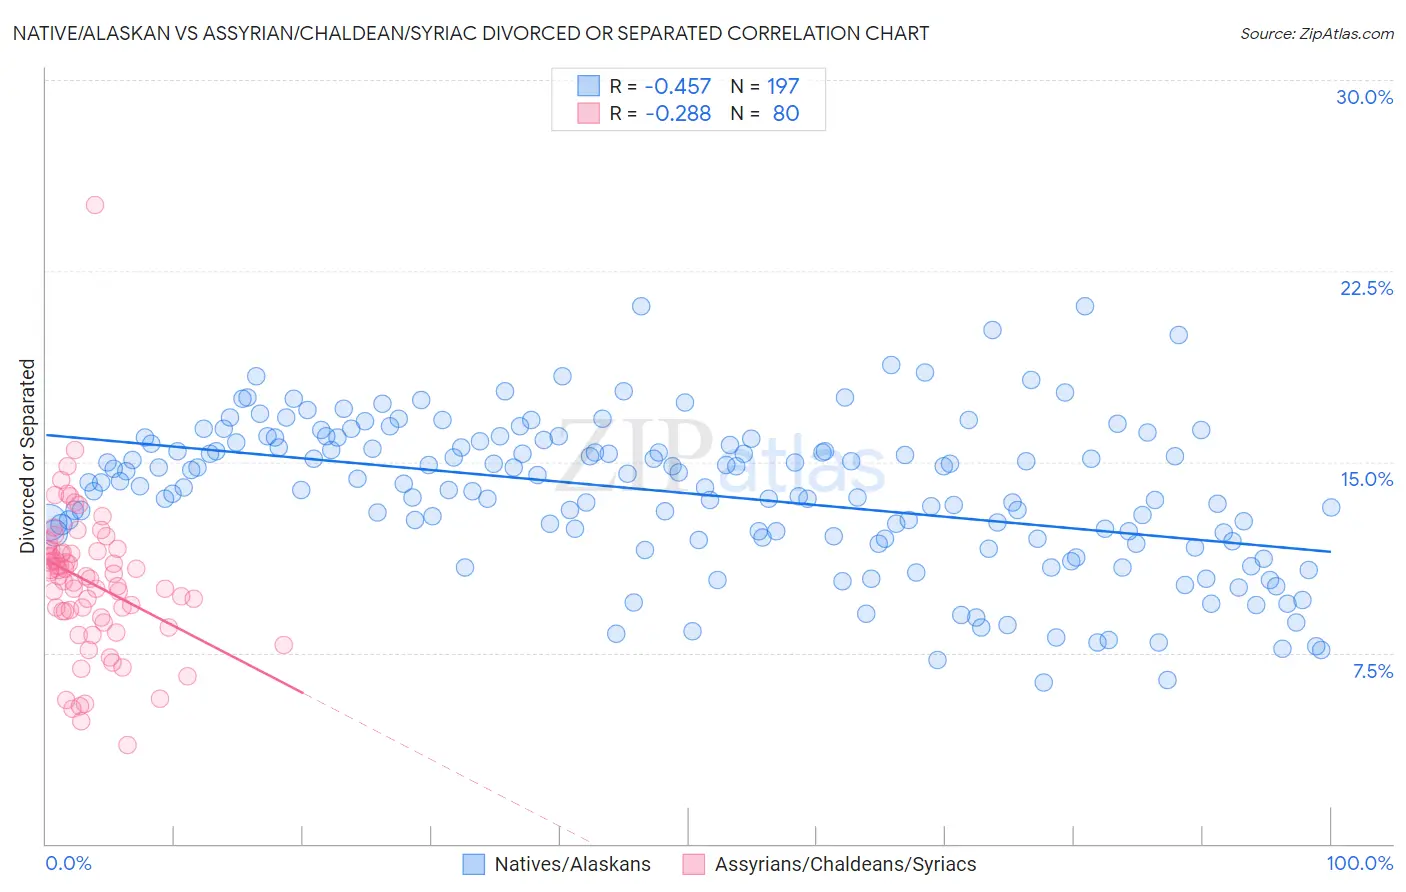
Native/Alaskan vs Assyrian/Chaldean/Syriac Divorced or Separated Correlation Chart
The statistical analysis conducted on geographies consisting of 512,782,555 people shows a moderate negative correlation between the proportion of Natives/Alaskans and percentage of population currently divorced or separated in the United States with a correlation coefficient (R) of -0.457 and weighted average of 13.0%. Similarly, the statistical analysis conducted on geographies consisting of 110,313,686 people shows a weak negative correlation between the proportion of Assyrians/Chaldeans/Syriacs and percentage of population currently divorced or separated in the United States with a correlation coefficient (R) of -0.288 and weighted average of 10.6%, a difference of 23.2%.
Divorced or Separated Correlation Summary
| Measurement | Native/Alaskan | Assyrian/Chaldean/Syriac |
| Minimum | 6.3% | 3.9% |
| Maximum | 21.1% | 25.1% |
| Range | 14.8% | 21.2% |
| Mean | 13.8% | 10.3% |
| Median | 14.1% | 10.5% |
| Interquartile 25% (IQ1) | 12.0% | 9.0% |
| Interquartile 75% (IQ3) | 15.8% | 11.5% |
| Interquartile Range (IQR) | 3.8% | 2.5% |
| Standard Deviation (Sample) | 2.9% | 2.9% |
| Standard Deviation (Population) | 2.9% | 2.9% |
Similar Demographics by Divorced or Separated
Demographics Similar to Natives/Alaskans by Divorced or Separated
In terms of divorced or separated, the demographic groups most similar to Natives/Alaskans are Nicaraguan (13.0%, a difference of 0.050%), Venezuelan (13.0%, a difference of 0.070%), Immigrants from Jamaica (13.0%, a difference of 0.10%), Celtic (13.0%, a difference of 0.47%), and Apache (12.9%, a difference of 0.60%).
| Demographics | Rating | Rank | Divorced or Separated |
| Pima | 0.0 /100 | #290 | Tragic 12.9% |
| Immigrants | Honduras | 0.0 /100 | #291 | Tragic 12.9% |
| Scotch-Irish | 0.0 /100 | #292 | Tragic 12.9% |
| Jamaicans | 0.0 /100 | #293 | Tragic 12.9% |
| Apache | 0.0 /100 | #294 | Tragic 12.9% |
| Celtics | 0.0 /100 | #295 | Tragic 13.0% |
| Nicaraguans | 0.0 /100 | #296 | Tragic 13.0% |
| Natives/Alaskans | 0.0 /100 | #297 | Tragic 13.0% |
| Venezuelans | 0.0 /100 | #298 | Tragic 13.0% |
| Immigrants | Jamaica | 0.0 /100 | #299 | Tragic 13.0% |
| Immigrants | Cabo Verde | 0.0 /100 | #300 | Tragic 13.1% |
| Alaskan Athabascans | 0.0 /100 | #301 | Tragic 13.1% |
| Immigrants | Venezuela | 0.0 /100 | #302 | Tragic 13.1% |
| Cape Verdeans | 0.0 /100 | #303 | Tragic 13.1% |
| Hopi | 0.0 /100 | #304 | Tragic 13.2% |
Demographics Similar to Assyrians/Chaldeans/Syriacs by Divorced or Separated
In terms of divorced or separated, the demographic groups most similar to Assyrians/Chaldeans/Syriacs are Immigrants from Armenia (10.6%, a difference of 0.070%), Immigrants from Korea (10.6%, a difference of 0.51%), Immigrants from Israel (10.6%, a difference of 0.62%), Immigrants from Iran (10.6%, a difference of 0.70%), and Asian (10.6%, a difference of 0.71%).
| Demographics | Rating | Rank | Divorced or Separated |
| Thais | 100.0 /100 | #7 | Exceptional 10.2% |
| Immigrants | Eastern Asia | 100.0 /100 | #8 | Exceptional 10.2% |
| Yup'ik | 100.0 /100 | #9 | Exceptional 10.3% |
| Immigrants | Singapore | 100.0 /100 | #10 | Exceptional 10.3% |
| Immigrants | South Central Asia | 100.0 /100 | #11 | Exceptional 10.4% |
| Okinawans | 100.0 /100 | #12 | Exceptional 10.5% |
| Cypriots | 100.0 /100 | #13 | Exceptional 10.5% |
| Assyrians/Chaldeans/Syriacs | 100.0 /100 | #14 | Exceptional 10.6% |
| Immigrants | Armenia | 100.0 /100 | #15 | Exceptional 10.6% |
| Immigrants | Korea | 100.0 /100 | #16 | Exceptional 10.6% |
| Immigrants | Israel | 100.0 /100 | #17 | Exceptional 10.6% |
| Immigrants | Iran | 100.0 /100 | #18 | Exceptional 10.6% |
| Asians | 100.0 /100 | #19 | Exceptional 10.6% |
| Burmese | 100.0 /100 | #20 | Exceptional 10.7% |
| Immigrants | Asia | 100.0 /100 | #21 | Exceptional 10.7% |