Immigrants from England vs European Divorced or Separated
COMPARE
Immigrants from England
European
Divorced or Separated
Divorced or Separated Comparison
Immigrants from England
Europeans
12.1%
DIVORCED OR SEPARATED
31.4/ 100
METRIC RATING
195th/ 347
METRIC RANK
12.2%
DIVORCED OR SEPARATED
15.4/ 100
METRIC RATING
215th/ 347
METRIC RANK
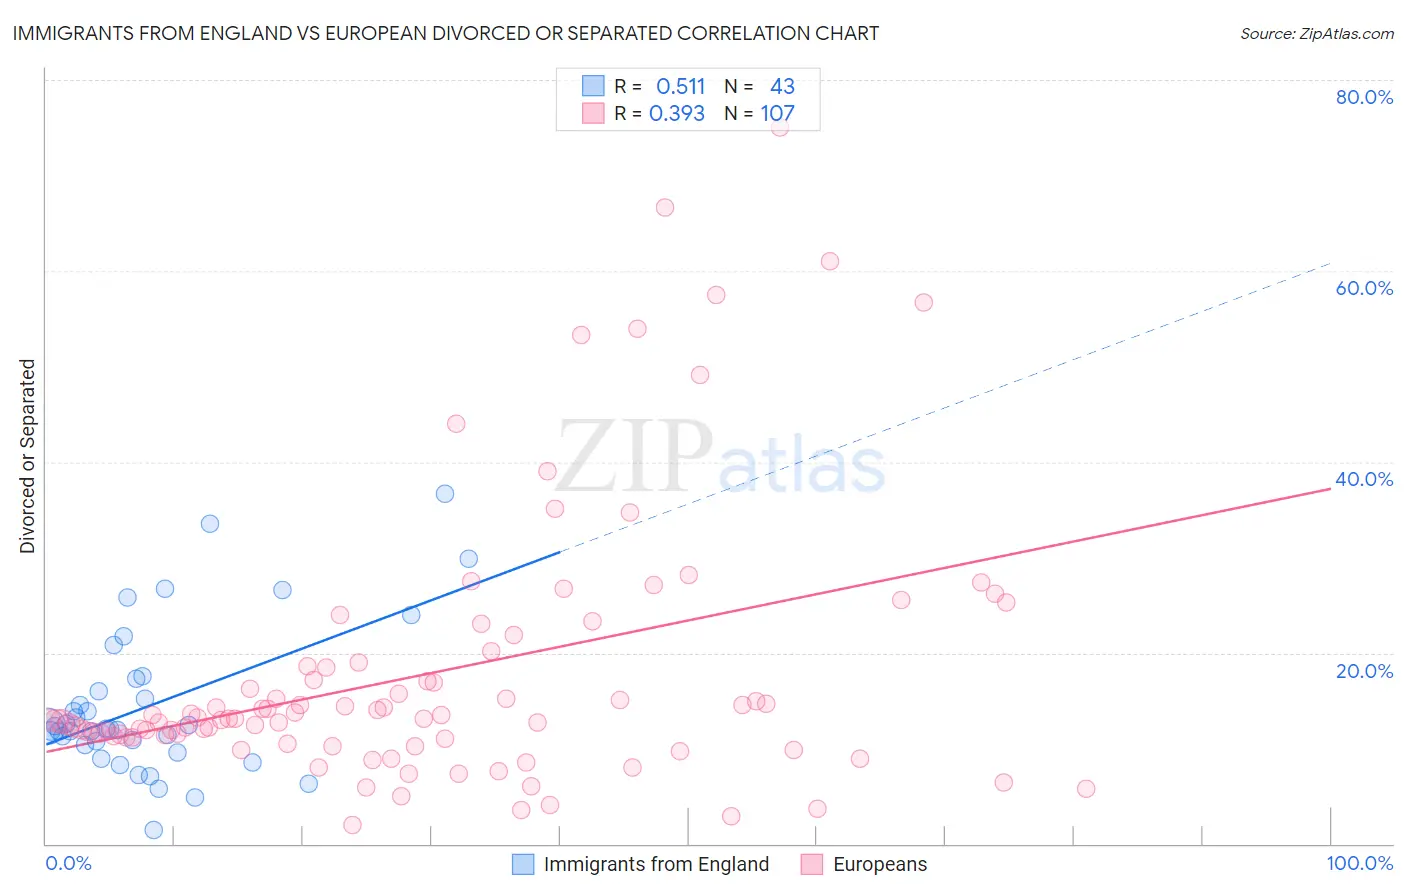
Immigrants from England vs European Divorced or Separated Correlation Chart
The statistical analysis conducted on geographies consisting of 391,787,172 people shows a substantial positive correlation between the proportion of Immigrants from England and percentage of population currently divorced or separated in the United States with a correlation coefficient (R) of 0.511 and weighted average of 12.1%. Similarly, the statistical analysis conducted on geographies consisting of 561,401,989 people shows a mild positive correlation between the proportion of Europeans and percentage of population currently divorced or separated in the United States with a correlation coefficient (R) of 0.393 and weighted average of 12.2%, a difference of 0.79%.
Divorced or Separated Correlation Summary
| Measurement | Immigrants from England | European |
| Minimum | 1.4% | 1.9% |
| Maximum | 36.6% | 75.0% |
| Range | 35.2% | 73.1% |
| Mean | 14.5% | 17.8% |
| Median | 12.1% | 13.0% |
| Interquartile 25% (IQ1) | 10.4% | 11.1% |
| Interquartile 75% (IQ3) | 17.3% | 18.6% |
| Interquartile Range (IQR) | 6.9% | 7.4% |
| Standard Deviation (Sample) | 7.7% | 14.0% |
| Standard Deviation (Population) | 7.6% | 14.0% |
Demographics Similar to Immigrants from England and Europeans by Divorced or Separated
In terms of divorced or separated, the demographic groups most similar to Immigrants from England are Immigrants from Burma/Myanmar (12.1%, a difference of 0.040%), Immigrants from Africa (12.1%, a difference of 0.040%), Nigerian (12.1%, a difference of 0.050%), Central American (12.1%, a difference of 0.080%), and South American (12.2%, a difference of 0.12%). Similarly, the demographic groups most similar to Europeans are Immigrants from Argentina (12.2%, a difference of 0.010%), Immigrants from Eastern Africa (12.2%, a difference of 0.050%), Immigrants from Kenya (12.2%, a difference of 0.070%), Trinidadian and Tobagonian (12.2%, a difference of 0.080%), and Slavic (12.2%, a difference of 0.10%).
| Demographics | Rating | Rank | Divorced or Separated |
| Immigrants | England | 31.4 /100 | #195 | Fair 12.1% |
| Immigrants | Burma/Myanmar | 30.4 /100 | #196 | Fair 12.1% |
| Immigrants | Africa | 30.3 /100 | #197 | Fair 12.1% |
| Nigerians | 30.1 /100 | #198 | Fair 12.1% |
| Central Americans | 29.4 /100 | #199 | Fair 12.1% |
| South Americans | 28.6 /100 | #200 | Fair 12.2% |
| Guatemalans | 26.9 /100 | #201 | Fair 12.2% |
| Portuguese | 23.5 /100 | #202 | Fair 12.2% |
| Immigrants | Guatemala | 23.2 /100 | #203 | Fair 12.2% |
| Kenyans | 21.8 /100 | #204 | Fair 12.2% |
| Immigrants | Costa Rica | 21.3 /100 | #205 | Fair 12.2% |
| Slovaks | 21.0 /100 | #206 | Fair 12.2% |
| Mexicans | 21.0 /100 | #207 | Fair 12.2% |
| Immigrants | Ghana | 18.8 /100 | #208 | Poor 12.2% |
| Immigrants | Trinidad and Tobago | 17.8 /100 | #209 | Poor 12.2% |
| Slavs | 17.0 /100 | #210 | Poor 12.2% |
| Trinidadians and Tobagonians | 16.6 /100 | #211 | Poor 12.2% |
| Immigrants | Kenya | 16.5 /100 | #212 | Poor 12.2% |
| Immigrants | Eastern Africa | 16.2 /100 | #213 | Poor 12.2% |
| Immigrants | Argentina | 15.5 /100 | #214 | Poor 12.2% |
| Europeans | 15.4 /100 | #215 | Poor 12.2% |