White/Caucasian vs European Divorced or Separated
COMPARE
White/Caucasian
European
Divorced or Separated
Divorced or Separated Comparison
Whites/Caucasians
Europeans
12.6%
DIVORCED OR SEPARATED
0.5/ 100
METRIC RATING
266th/ 347
METRIC RANK
12.2%
DIVORCED OR SEPARATED
15.4/ 100
METRIC RATING
215th/ 347
METRIC RANK
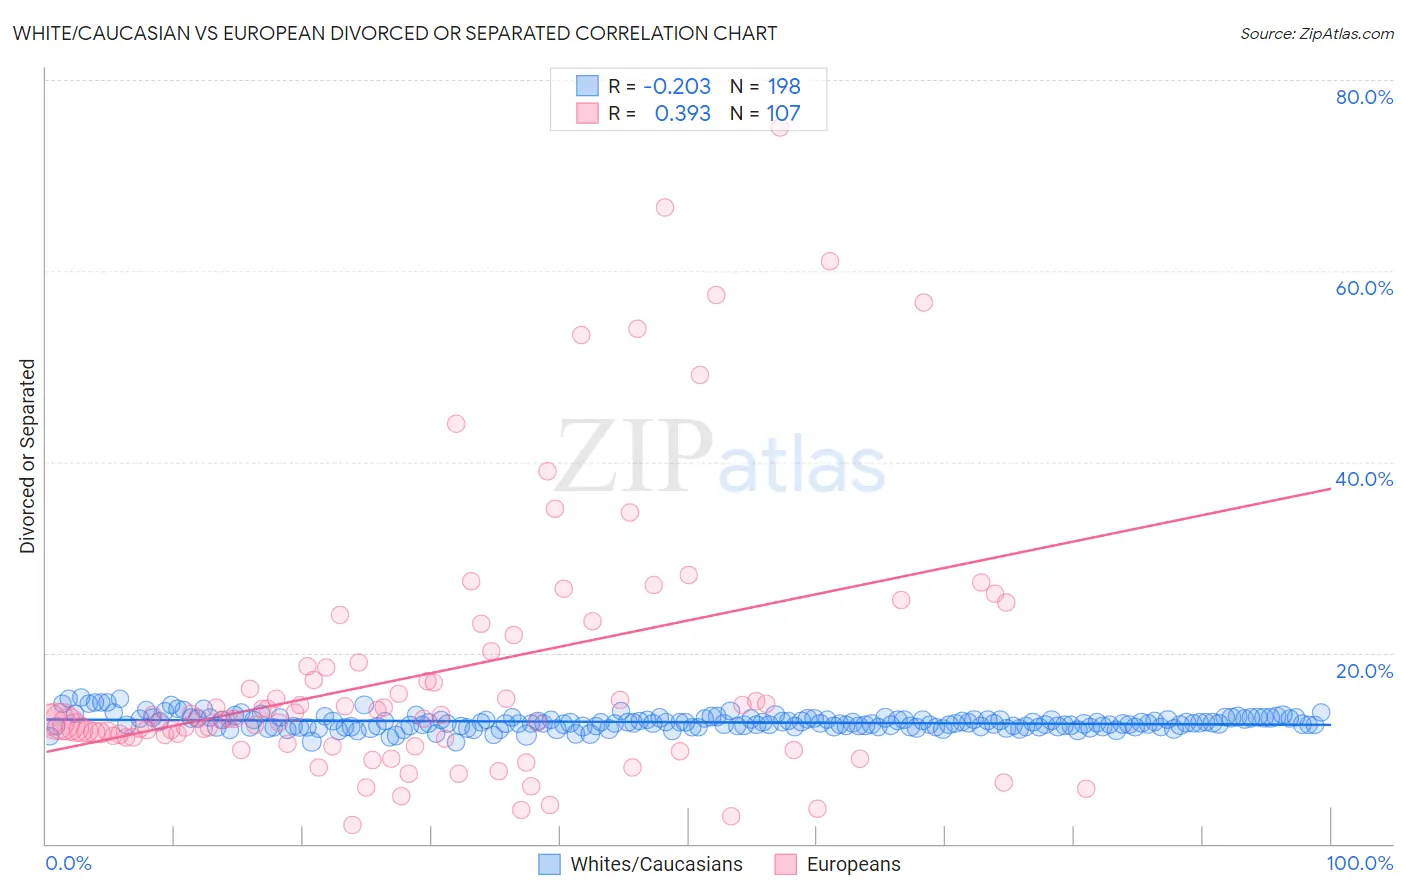
White/Caucasian vs European Divorced or Separated Correlation Chart
The statistical analysis conducted on geographies consisting of 582,391,050 people shows a weak negative correlation between the proportion of Whites/Caucasians and percentage of population currently divorced or separated in the United States with a correlation coefficient (R) of -0.203 and weighted average of 12.6%. Similarly, the statistical analysis conducted on geographies consisting of 561,401,989 people shows a mild positive correlation between the proportion of Europeans and percentage of population currently divorced or separated in the United States with a correlation coefficient (R) of 0.393 and weighted average of 12.2%, a difference of 3.2%.
Divorced or Separated Correlation Summary
| Measurement | White/Caucasian | European |
| Minimum | 10.6% | 1.9% |
| Maximum | 15.4% | 75.0% |
| Range | 4.7% | 73.1% |
| Mean | 12.7% | 17.8% |
| Median | 12.6% | 13.0% |
| Interquartile 25% (IQ1) | 12.3% | 11.1% |
| Interquartile 75% (IQ3) | 13.1% | 18.6% |
| Interquartile Range (IQR) | 0.82% | 7.4% |
| Standard Deviation (Sample) | 0.77% | 14.0% |
| Standard Deviation (Population) | 0.77% | 14.0% |
Similar Demographics by Divorced or Separated
Demographics Similar to Whites/Caucasians by Divorced or Separated
In terms of divorced or separated, the demographic groups most similar to Whites/Caucasians are Immigrants from Senegal (12.6%, a difference of 0.010%), English (12.6%, a difference of 0.030%), Scottish (12.6%, a difference of 0.040%), Immigrants from Panama (12.6%, a difference of 0.050%), and Fijian (12.6%, a difference of 0.060%).
| Demographics | Rating | Rank | Divorced or Separated |
| Yuman | 0.6 /100 | #259 | Tragic 12.6% |
| Immigrants | Uruguay | 0.6 /100 | #260 | Tragic 12.6% |
| Immigrants | Dominica | 0.5 /100 | #261 | Tragic 12.6% |
| Basques | 0.5 /100 | #262 | Tragic 12.6% |
| Immigrants | Panama | 0.5 /100 | #263 | Tragic 12.6% |
| English | 0.5 /100 | #264 | Tragic 12.6% |
| Immigrants | Senegal | 0.5 /100 | #265 | Tragic 12.6% |
| Whites/Caucasians | 0.5 /100 | #266 | Tragic 12.6% |
| Scottish | 0.4 /100 | #267 | Tragic 12.6% |
| Fijians | 0.4 /100 | #268 | Tragic 12.6% |
| Immigrants | Liberia | 0.4 /100 | #269 | Tragic 12.6% |
| Ute | 0.4 /100 | #270 | Tragic 12.6% |
| Panamanians | 0.3 /100 | #271 | Tragic 12.7% |
| Immigrants | Middle Africa | 0.3 /100 | #272 | Tragic 12.7% |
| Immigrants | Micronesia | 0.3 /100 | #273 | Tragic 12.7% |
Demographics Similar to Europeans by Divorced or Separated
In terms of divorced or separated, the demographic groups most similar to Europeans are Immigrants from South America (12.2%, a difference of 0.0%), Immigrants from Argentina (12.2%, a difference of 0.010%), Immigrants from Eastern Africa (12.2%, a difference of 0.050%), Northern European (12.2%, a difference of 0.050%), and Immigrants from Kenya (12.2%, a difference of 0.070%).
| Demographics | Rating | Rank | Divorced or Separated |
| Immigrants | Ghana | 18.8 /100 | #208 | Poor 12.2% |
| Immigrants | Trinidad and Tobago | 17.8 /100 | #209 | Poor 12.2% |
| Slavs | 17.0 /100 | #210 | Poor 12.2% |
| Trinidadians and Tobagonians | 16.6 /100 | #211 | Poor 12.2% |
| Immigrants | Kenya | 16.5 /100 | #212 | Poor 12.2% |
| Immigrants | Eastern Africa | 16.2 /100 | #213 | Poor 12.2% |
| Immigrants | Argentina | 15.5 /100 | #214 | Poor 12.2% |
| Europeans | 15.4 /100 | #215 | Poor 12.2% |
| Immigrants | South America | 15.4 /100 | #216 | Poor 12.2% |
| Northern Europeans | 14.7 /100 | #217 | Poor 12.2% |
| Slovenes | 13.2 /100 | #218 | Poor 12.3% |
| Czechoslovakians | 11.7 /100 | #219 | Poor 12.3% |
| British | 11.6 /100 | #220 | Poor 12.3% |
| Guamanians/Chamorros | 11.3 /100 | #221 | Poor 12.3% |
| Bangladeshis | 10.5 /100 | #222 | Poor 12.3% |