Cypriot vs European Divorced or Separated
COMPARE
Cypriot
European
Divorced or Separated
Divorced or Separated Comparison
Cypriots
Europeans
10.5%
DIVORCED OR SEPARATED
100.0/ 100
METRIC RATING
13th/ 347
METRIC RANK
12.2%
DIVORCED OR SEPARATED
15.4/ 100
METRIC RATING
215th/ 347
METRIC RANK
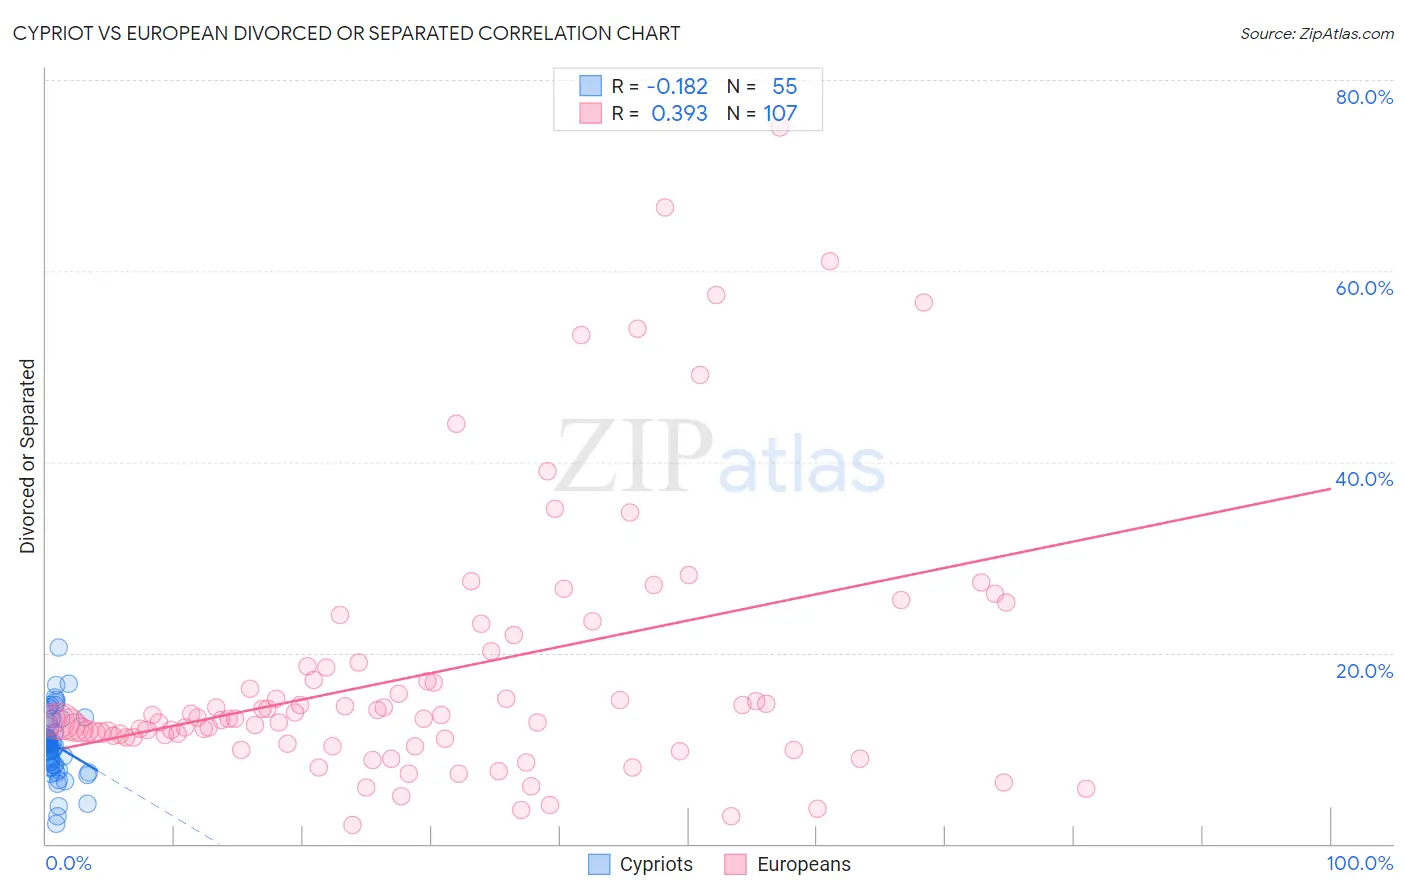
Cypriot vs European Divorced or Separated Correlation Chart
The statistical analysis conducted on geographies consisting of 61,840,758 people shows a poor negative correlation between the proportion of Cypriots and percentage of population currently divorced or separated in the United States with a correlation coefficient (R) of -0.182 and weighted average of 10.5%. Similarly, the statistical analysis conducted on geographies consisting of 561,401,989 people shows a mild positive correlation between the proportion of Europeans and percentage of population currently divorced or separated in the United States with a correlation coefficient (R) of 0.393 and weighted average of 12.2%, a difference of 16.7%.
Divorced or Separated Correlation Summary
| Measurement | Cypriot | European |
| Minimum | 2.1% | 1.9% |
| Maximum | 20.6% | 75.0% |
| Range | 18.5% | 73.1% |
| Mean | 10.3% | 17.8% |
| Median | 10.3% | 13.0% |
| Interquartile 25% (IQ1) | 8.0% | 11.1% |
| Interquartile 75% (IQ3) | 12.7% | 18.6% |
| Interquartile Range (IQR) | 4.7% | 7.4% |
| Standard Deviation (Sample) | 3.5% | 14.0% |
| Standard Deviation (Population) | 3.5% | 14.0% |
Similar Demographics by Divorced or Separated
Demographics Similar to Cypriots by Divorced or Separated
In terms of divorced or separated, the demographic groups most similar to Cypriots are Okinawan (10.5%, a difference of 0.16%), Immigrants from South Central Asia (10.4%, a difference of 0.49%), Assyrian/Chaldean/Syriac (10.6%, a difference of 0.74%), Immigrants from Armenia (10.6%, a difference of 0.81%), and Immigrants from Korea (10.6%, a difference of 1.3%).
| Demographics | Rating | Rank | Divorced or Separated |
| Indians (Asian) | 100.0 /100 | #6 | Exceptional 10.2% |
| Thais | 100.0 /100 | #7 | Exceptional 10.2% |
| Immigrants | Eastern Asia | 100.0 /100 | #8 | Exceptional 10.2% |
| Yup'ik | 100.0 /100 | #9 | Exceptional 10.3% |
| Immigrants | Singapore | 100.0 /100 | #10 | Exceptional 10.3% |
| Immigrants | South Central Asia | 100.0 /100 | #11 | Exceptional 10.4% |
| Okinawans | 100.0 /100 | #12 | Exceptional 10.5% |
| Cypriots | 100.0 /100 | #13 | Exceptional 10.5% |
| Assyrians/Chaldeans/Syriacs | 100.0 /100 | #14 | Exceptional 10.6% |
| Immigrants | Armenia | 100.0 /100 | #15 | Exceptional 10.6% |
| Immigrants | Korea | 100.0 /100 | #16 | Exceptional 10.6% |
| Immigrants | Israel | 100.0 /100 | #17 | Exceptional 10.6% |
| Immigrants | Iran | 100.0 /100 | #18 | Exceptional 10.6% |
| Asians | 100.0 /100 | #19 | Exceptional 10.6% |
| Burmese | 100.0 /100 | #20 | Exceptional 10.7% |
Demographics Similar to Europeans by Divorced or Separated
In terms of divorced or separated, the demographic groups most similar to Europeans are Immigrants from South America (12.2%, a difference of 0.0%), Immigrants from Argentina (12.2%, a difference of 0.010%), Immigrants from Eastern Africa (12.2%, a difference of 0.050%), Northern European (12.2%, a difference of 0.050%), and Immigrants from Kenya (12.2%, a difference of 0.070%).
| Demographics | Rating | Rank | Divorced or Separated |
| Immigrants | Ghana | 18.8 /100 | #208 | Poor 12.2% |
| Immigrants | Trinidad and Tobago | 17.8 /100 | #209 | Poor 12.2% |
| Slavs | 17.0 /100 | #210 | Poor 12.2% |
| Trinidadians and Tobagonians | 16.6 /100 | #211 | Poor 12.2% |
| Immigrants | Kenya | 16.5 /100 | #212 | Poor 12.2% |
| Immigrants | Eastern Africa | 16.2 /100 | #213 | Poor 12.2% |
| Immigrants | Argentina | 15.5 /100 | #214 | Poor 12.2% |
| Europeans | 15.4 /100 | #215 | Poor 12.2% |
| Immigrants | South America | 15.4 /100 | #216 | Poor 12.2% |
| Northern Europeans | 14.7 /100 | #217 | Poor 12.2% |
| Slovenes | 13.2 /100 | #218 | Poor 12.3% |
| Czechoslovakians | 11.7 /100 | #219 | Poor 12.3% |
| British | 11.6 /100 | #220 | Poor 12.3% |
| Guamanians/Chamorros | 11.3 /100 | #221 | Poor 12.3% |
| Bangladeshis | 10.5 /100 | #222 | Poor 12.3% |