Native/Alaskan vs Native Hawaiian Divorced or Separated
COMPARE
Native/Alaskan
Native Hawaiian
Divorced or Separated
Divorced or Separated Comparison
Natives/Alaskans
Native Hawaiians
13.0%
DIVORCED OR SEPARATED
0.0/ 100
METRIC RATING
297th/ 347
METRIC RANK
11.7%
DIVORCED OR SEPARATED
97.2/ 100
METRIC RATING
107th/ 347
METRIC RANK
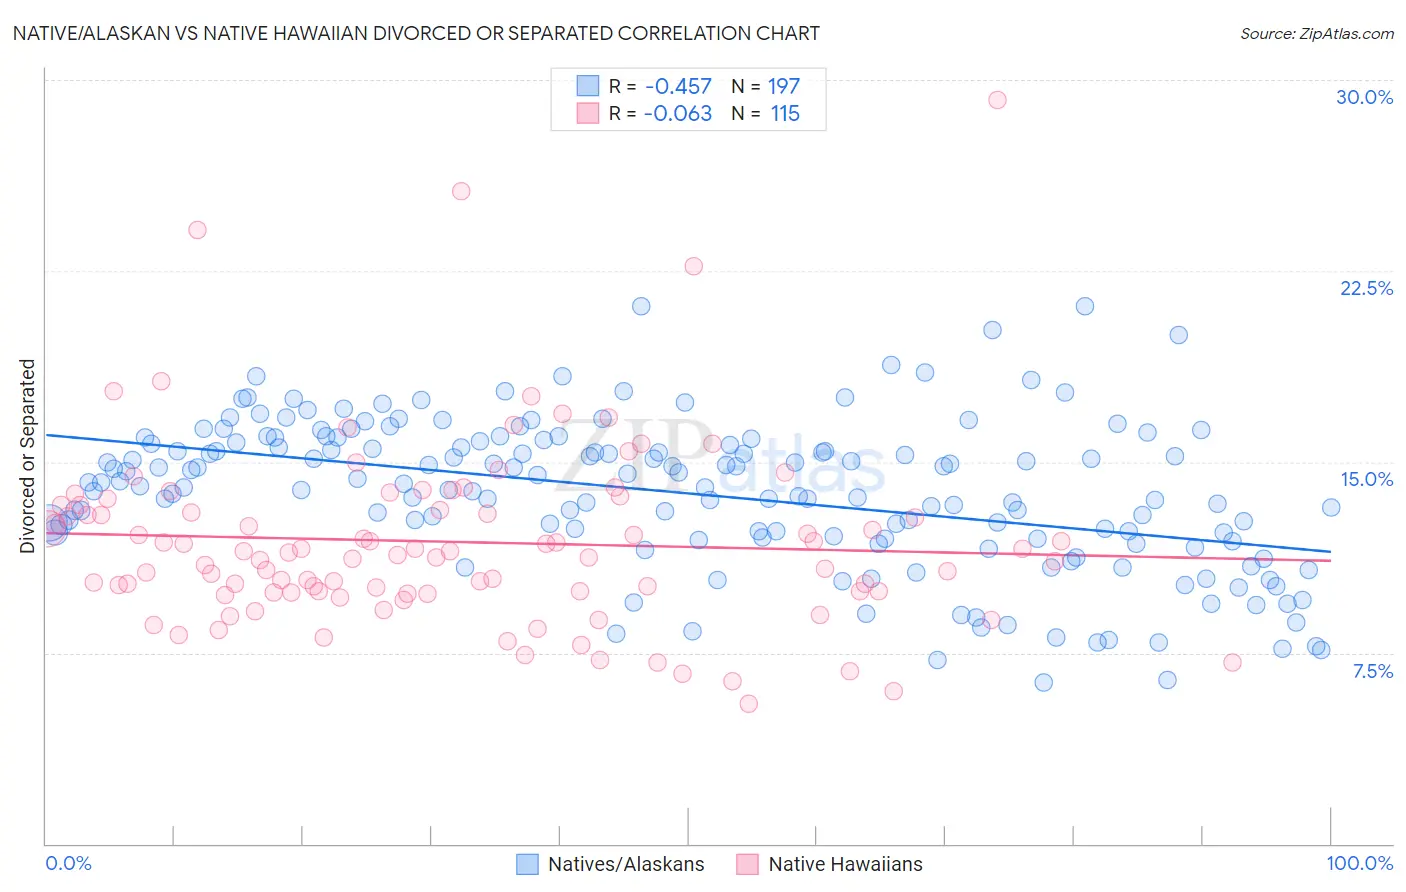
Native/Alaskan vs Native Hawaiian Divorced or Separated Correlation Chart
The statistical analysis conducted on geographies consisting of 512,782,555 people shows a moderate negative correlation between the proportion of Natives/Alaskans and percentage of population currently divorced or separated in the United States with a correlation coefficient (R) of -0.457 and weighted average of 13.0%. Similarly, the statistical analysis conducted on geographies consisting of 331,991,135 people shows a slight negative correlation between the proportion of Native Hawaiians and percentage of population currently divorced or separated in the United States with a correlation coefficient (R) of -0.063 and weighted average of 11.7%, a difference of 11.4%.
Divorced or Separated Correlation Summary
| Measurement | Native/Alaskan | Native Hawaiian |
| Minimum | 6.3% | 5.5% |
| Maximum | 21.1% | 29.2% |
| Range | 14.8% | 23.7% |
| Mean | 13.8% | 11.9% |
| Median | 14.1% | 11.3% |
| Interquartile 25% (IQ1) | 12.0% | 9.9% |
| Interquartile 75% (IQ3) | 15.8% | 13.3% |
| Interquartile Range (IQR) | 3.8% | 3.4% |
| Standard Deviation (Sample) | 2.9% | 3.7% |
| Standard Deviation (Population) | 2.9% | 3.7% |
Similar Demographics by Divorced or Separated
Demographics Similar to Natives/Alaskans by Divorced or Separated
In terms of divorced or separated, the demographic groups most similar to Natives/Alaskans are Nicaraguan (13.0%, a difference of 0.050%), Venezuelan (13.0%, a difference of 0.070%), Immigrants from Jamaica (13.0%, a difference of 0.10%), Celtic (13.0%, a difference of 0.47%), and Apache (12.9%, a difference of 0.60%).
| Demographics | Rating | Rank | Divorced or Separated |
| Pima | 0.0 /100 | #290 | Tragic 12.9% |
| Immigrants | Honduras | 0.0 /100 | #291 | Tragic 12.9% |
| Scotch-Irish | 0.0 /100 | #292 | Tragic 12.9% |
| Jamaicans | 0.0 /100 | #293 | Tragic 12.9% |
| Apache | 0.0 /100 | #294 | Tragic 12.9% |
| Celtics | 0.0 /100 | #295 | Tragic 13.0% |
| Nicaraguans | 0.0 /100 | #296 | Tragic 13.0% |
| Natives/Alaskans | 0.0 /100 | #297 | Tragic 13.0% |
| Venezuelans | 0.0 /100 | #298 | Tragic 13.0% |
| Immigrants | Jamaica | 0.0 /100 | #299 | Tragic 13.0% |
| Immigrants | Cabo Verde | 0.0 /100 | #300 | Tragic 13.1% |
| Alaskan Athabascans | 0.0 /100 | #301 | Tragic 13.1% |
| Immigrants | Venezuela | 0.0 /100 | #302 | Tragic 13.1% |
| Cape Verdeans | 0.0 /100 | #303 | Tragic 13.1% |
| Hopi | 0.0 /100 | #304 | Tragic 13.2% |
Demographics Similar to Native Hawaiians by Divorced or Separated
In terms of divorced or separated, the demographic groups most similar to Native Hawaiians are Greek (11.7%, a difference of 0.090%), Immigrants from South Africa (11.7%, a difference of 0.10%), Immigrants from Czechoslovakia (11.7%, a difference of 0.10%), Immigrants from Spain (11.7%, a difference of 0.14%), and Immigrants from France (11.7%, a difference of 0.19%).
| Demographics | Rating | Rank | Divorced or Separated |
| Immigrants | Northern Europe | 98.6 /100 | #100 | Exceptional 11.6% |
| Immigrants | Guyana | 98.5 /100 | #101 | Exceptional 11.6% |
| Immigrants | Croatia | 98.3 /100 | #102 | Exceptional 11.6% |
| Maltese | 98.2 /100 | #103 | Exceptional 11.6% |
| Salvadorans | 98.2 /100 | #104 | Exceptional 11.6% |
| Immigrants | El Salvador | 97.9 /100 | #105 | Exceptional 11.7% |
| Immigrants | Kazakhstan | 97.8 /100 | #106 | Exceptional 11.7% |
| Native Hawaiians | 97.2 /100 | #107 | Exceptional 11.7% |
| Greeks | 96.9 /100 | #108 | Exceptional 11.7% |
| Immigrants | South Africa | 96.9 /100 | #109 | Exceptional 11.7% |
| Immigrants | Czechoslovakia | 96.9 /100 | #110 | Exceptional 11.7% |
| Immigrants | Spain | 96.8 /100 | #111 | Exceptional 11.7% |
| Immigrants | France | 96.6 /100 | #112 | Exceptional 11.7% |
| Estonians | 96.6 /100 | #113 | Exceptional 11.7% |
| Immigrants | Norway | 95.9 /100 | #114 | Exceptional 11.7% |