Native/Alaskan vs Spaniard Divorced or Separated
COMPARE
Native/Alaskan
Spaniard
Divorced or Separated
Divorced or Separated Comparison
Natives/Alaskans
Spaniards
13.0%
DIVORCED OR SEPARATED
0.0/ 100
METRIC RATING
297th/ 347
METRIC RANK
12.7%
DIVORCED OR SEPARATED
0.2/ 100
METRIC RATING
276th/ 347
METRIC RANK
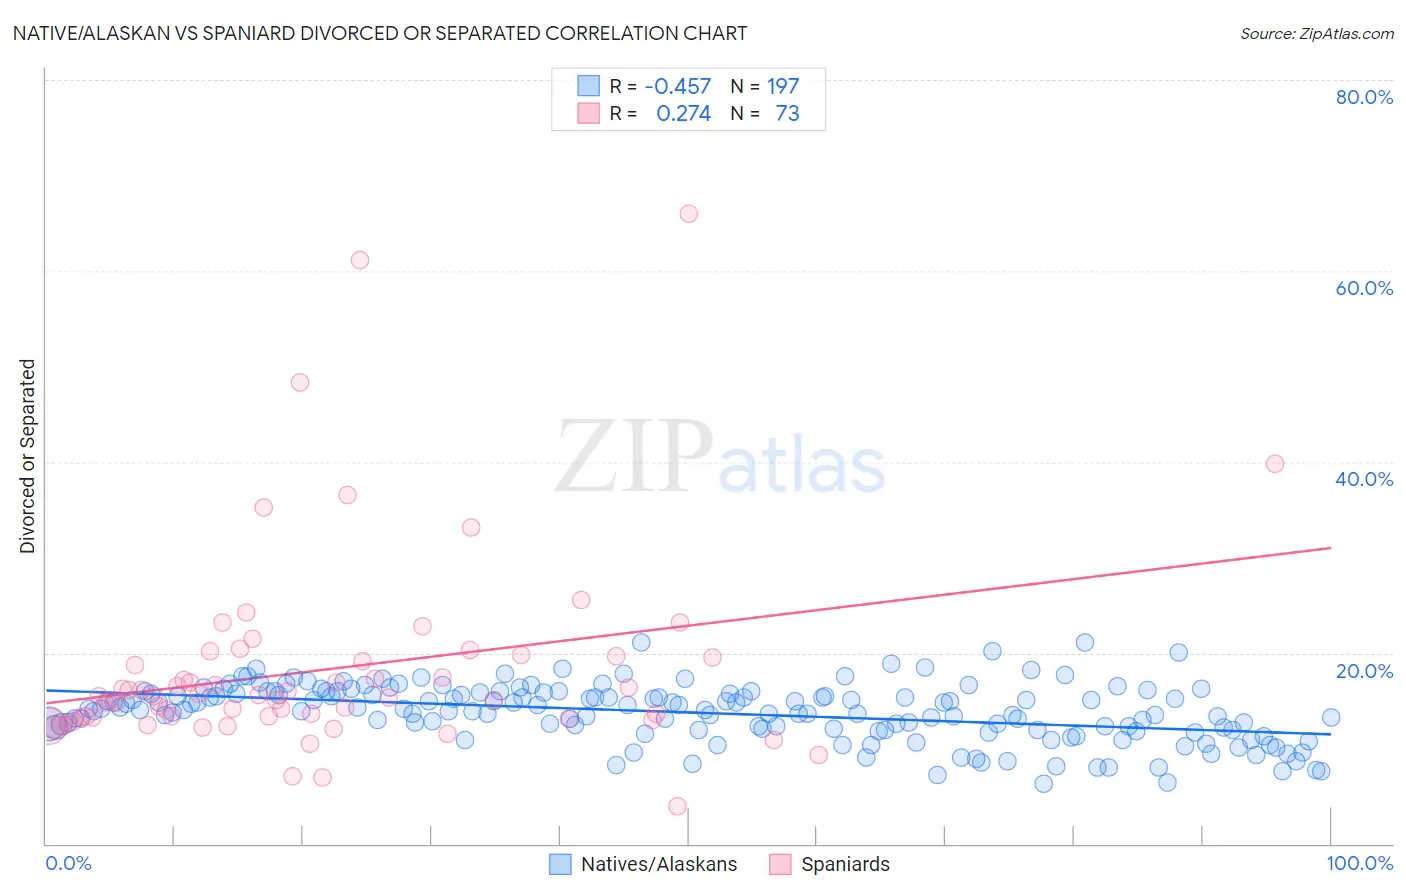
Native/Alaskan vs Spaniard Divorced or Separated Correlation Chart
The statistical analysis conducted on geographies consisting of 512,782,555 people shows a moderate negative correlation between the proportion of Natives/Alaskans and percentage of population currently divorced or separated in the United States with a correlation coefficient (R) of -0.457 and weighted average of 13.0%. Similarly, the statistical analysis conducted on geographies consisting of 443,302,888 people shows a weak positive correlation between the proportion of Spaniards and percentage of population currently divorced or separated in the United States with a correlation coefficient (R) of 0.274 and weighted average of 12.7%, a difference of 2.6%.
Divorced or Separated Correlation Summary
| Measurement | Native/Alaskan | Spaniard |
| Minimum | 6.3% | 3.9% |
| Maximum | 21.1% | 66.0% |
| Range | 14.8% | 62.1% |
| Mean | 13.8% | 18.3% |
| Median | 14.1% | 15.4% |
| Interquartile 25% (IQ1) | 12.0% | 13.2% |
| Interquartile 75% (IQ3) | 15.8% | 19.5% |
| Interquartile Range (IQR) | 3.8% | 6.3% |
| Standard Deviation (Sample) | 2.9% | 10.5% |
| Standard Deviation (Population) | 2.9% | 10.4% |
Similar Demographics by Divorced or Separated
Demographics Similar to Natives/Alaskans by Divorced or Separated
In terms of divorced or separated, the demographic groups most similar to Natives/Alaskans are Nicaraguan (13.0%, a difference of 0.050%), Venezuelan (13.0%, a difference of 0.070%), Immigrants from Jamaica (13.0%, a difference of 0.10%), Celtic (13.0%, a difference of 0.47%), and Apache (12.9%, a difference of 0.60%).
| Demographics | Rating | Rank | Divorced or Separated |
| Pima | 0.0 /100 | #290 | Tragic 12.9% |
| Immigrants | Honduras | 0.0 /100 | #291 | Tragic 12.9% |
| Scotch-Irish | 0.0 /100 | #292 | Tragic 12.9% |
| Jamaicans | 0.0 /100 | #293 | Tragic 12.9% |
| Apache | 0.0 /100 | #294 | Tragic 12.9% |
| Celtics | 0.0 /100 | #295 | Tragic 13.0% |
| Nicaraguans | 0.0 /100 | #296 | Tragic 13.0% |
| Natives/Alaskans | 0.0 /100 | #297 | Tragic 13.0% |
| Venezuelans | 0.0 /100 | #298 | Tragic 13.0% |
| Immigrants | Jamaica | 0.0 /100 | #299 | Tragic 13.0% |
| Immigrants | Cabo Verde | 0.0 /100 | #300 | Tragic 13.1% |
| Alaskan Athabascans | 0.0 /100 | #301 | Tragic 13.1% |
| Immigrants | Venezuela | 0.0 /100 | #302 | Tragic 13.1% |
| Cape Verdeans | 0.0 /100 | #303 | Tragic 13.1% |
| Hopi | 0.0 /100 | #304 | Tragic 13.2% |
Demographics Similar to Spaniards by Divorced or Separated
In terms of divorced or separated, the demographic groups most similar to Spaniards are Dominican (12.7%, a difference of 0.050%), Central American Indian (12.7%, a difference of 0.060%), Bermudan (12.7%, a difference of 0.090%), Immigrants from Micronesia (12.7%, a difference of 0.10%), and Lumbee (12.7%, a difference of 0.21%).
| Demographics | Rating | Rank | Divorced or Separated |
| Immigrants | Liberia | 0.4 /100 | #269 | Tragic 12.6% |
| Ute | 0.4 /100 | #270 | Tragic 12.6% |
| Panamanians | 0.3 /100 | #271 | Tragic 12.7% |
| Immigrants | Middle Africa | 0.3 /100 | #272 | Tragic 12.7% |
| Immigrants | Micronesia | 0.3 /100 | #273 | Tragic 12.7% |
| Bermudans | 0.3 /100 | #274 | Tragic 12.7% |
| Central American Indians | 0.3 /100 | #275 | Tragic 12.7% |
| Spaniards | 0.2 /100 | #276 | Tragic 12.7% |
| Dominicans | 0.2 /100 | #277 | Tragic 12.7% |
| Lumbee | 0.2 /100 | #278 | Tragic 12.7% |
| Immigrants | Dominican Republic | 0.2 /100 | #279 | Tragic 12.7% |
| Immigrants | Zaire | 0.2 /100 | #280 | Tragic 12.7% |
| Pueblo | 0.2 /100 | #281 | Tragic 12.7% |
| Sub-Saharan Africans | 0.1 /100 | #282 | Tragic 12.7% |
| Delaware | 0.1 /100 | #283 | Tragic 12.7% |