Italian vs European Divorced or Separated
COMPARE
Italian
European
Divorced or Separated
Divorced or Separated Comparison
Italians
Europeans
11.9%
DIVORCED OR SEPARATED
77.8/ 100
METRIC RATING
148th/ 347
METRIC RANK
12.2%
DIVORCED OR SEPARATED
15.4/ 100
METRIC RATING
215th/ 347
METRIC RANK
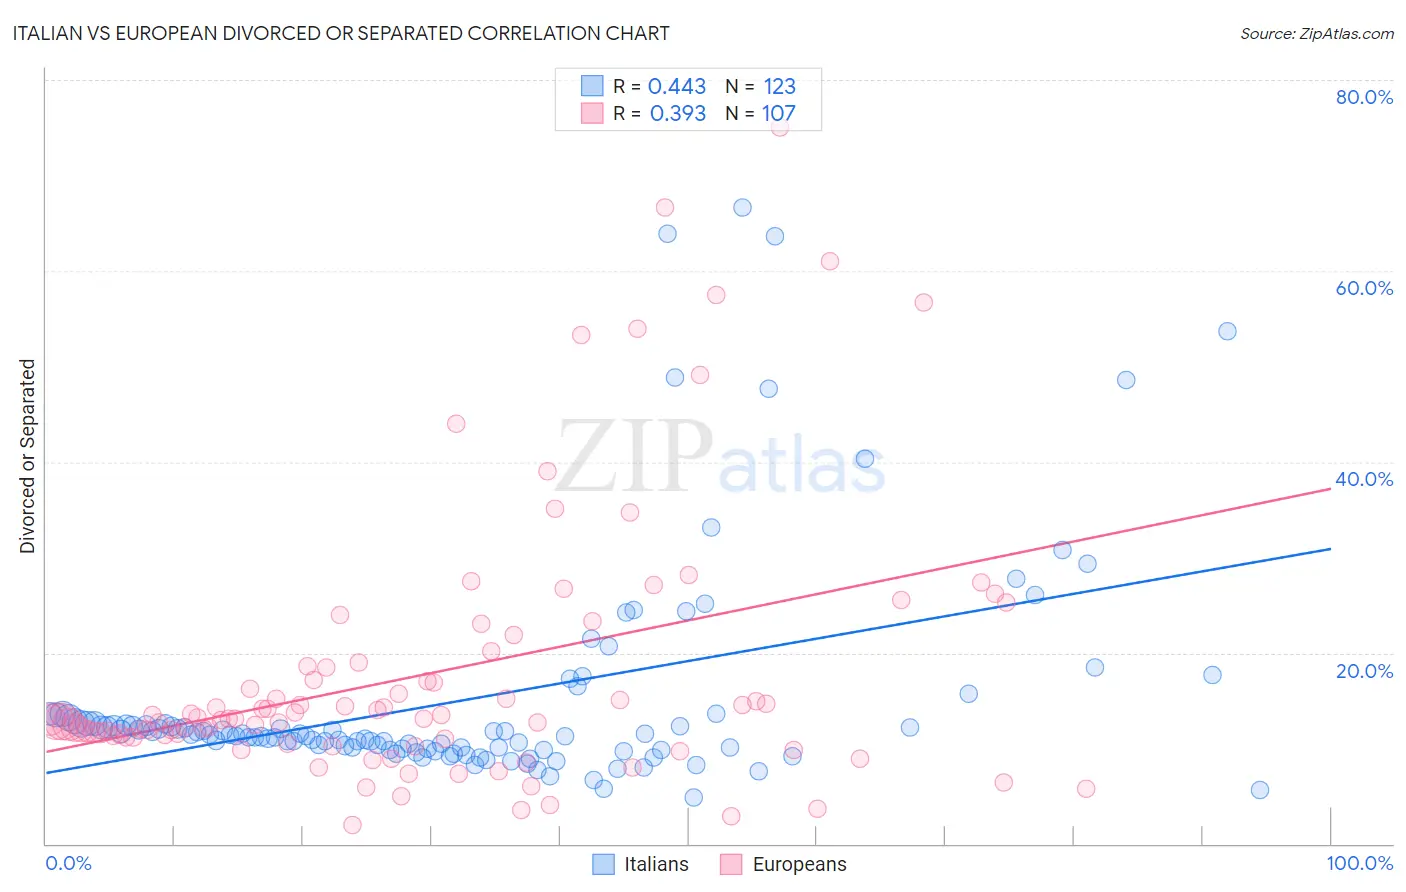
Italian vs European Divorced or Separated Correlation Chart
The statistical analysis conducted on geographies consisting of 574,595,053 people shows a moderate positive correlation between the proportion of Italians and percentage of population currently divorced or separated in the United States with a correlation coefficient (R) of 0.443 and weighted average of 11.9%. Similarly, the statistical analysis conducted on geographies consisting of 561,401,989 people shows a mild positive correlation between the proportion of Europeans and percentage of population currently divorced or separated in the United States with a correlation coefficient (R) of 0.393 and weighted average of 12.2%, a difference of 2.6%.
Divorced or Separated Correlation Summary
| Measurement | Italian | European |
| Minimum | 4.8% | 1.9% |
| Maximum | 66.7% | 75.0% |
| Range | 61.9% | 73.1% |
| Mean | 15.1% | 17.8% |
| Median | 11.4% | 13.0% |
| Interquartile 25% (IQ1) | 10.0% | 11.1% |
| Interquartile 75% (IQ3) | 12.8% | 18.6% |
| Interquartile Range (IQR) | 2.9% | 7.4% |
| Standard Deviation (Sample) | 11.7% | 14.0% |
| Standard Deviation (Population) | 11.6% | 14.0% |
Similar Demographics by Divorced or Separated
Demographics Similar to Italians by Divorced or Separated
In terms of divorced or separated, the demographic groups most similar to Italians are Immigrants from Oceania (11.9%, a difference of 0.0%), Immigrants from Portugal (11.9%, a difference of 0.030%), Polish (11.9%, a difference of 0.040%), Immigrants from Grenada (11.9%, a difference of 0.070%), and Czech (11.9%, a difference of 0.070%).
| Demographics | Rating | Rank | Divorced or Separated |
| Immigrants | Morocco | 82.9 /100 | #141 | Excellent 11.9% |
| Immigrants | Zimbabwe | 81.5 /100 | #142 | Excellent 11.9% |
| Pakistanis | 81.3 /100 | #143 | Excellent 11.9% |
| Peruvians | 80.9 /100 | #144 | Excellent 11.9% |
| Croatians | 80.6 /100 | #145 | Excellent 11.9% |
| Immigrants | Grenada | 79.1 /100 | #146 | Good 11.9% |
| Poles | 78.6 /100 | #147 | Good 11.9% |
| Italians | 77.8 /100 | #148 | Good 11.9% |
| Immigrants | Oceania | 77.7 /100 | #149 | Good 11.9% |
| Immigrants | Portugal | 77.3 /100 | #150 | Good 11.9% |
| Czechs | 76.4 /100 | #151 | Good 11.9% |
| Immigrants | Hungary | 73.7 /100 | #152 | Good 11.9% |
| Austrians | 72.2 /100 | #153 | Good 12.0% |
| Chileans | 71.3 /100 | #154 | Good 12.0% |
| Japanese | 70.9 /100 | #155 | Good 12.0% |
Demographics Similar to Europeans by Divorced or Separated
In terms of divorced or separated, the demographic groups most similar to Europeans are Immigrants from South America (12.2%, a difference of 0.0%), Immigrants from Argentina (12.2%, a difference of 0.010%), Immigrants from Eastern Africa (12.2%, a difference of 0.050%), Northern European (12.2%, a difference of 0.050%), and Immigrants from Kenya (12.2%, a difference of 0.070%).
| Demographics | Rating | Rank | Divorced or Separated |
| Immigrants | Ghana | 18.8 /100 | #208 | Poor 12.2% |
| Immigrants | Trinidad and Tobago | 17.8 /100 | #209 | Poor 12.2% |
| Slavs | 17.0 /100 | #210 | Poor 12.2% |
| Trinidadians and Tobagonians | 16.6 /100 | #211 | Poor 12.2% |
| Immigrants | Kenya | 16.5 /100 | #212 | Poor 12.2% |
| Immigrants | Eastern Africa | 16.2 /100 | #213 | Poor 12.2% |
| Immigrants | Argentina | 15.5 /100 | #214 | Poor 12.2% |
| Europeans | 15.4 /100 | #215 | Poor 12.2% |
| Immigrants | South America | 15.4 /100 | #216 | Poor 12.2% |
| Northern Europeans | 14.7 /100 | #217 | Poor 12.2% |
| Slovenes | 13.2 /100 | #218 | Poor 12.3% |
| Czechoslovakians | 11.7 /100 | #219 | Poor 12.3% |
| British | 11.6 /100 | #220 | Poor 12.3% |
| Guamanians/Chamorros | 11.3 /100 | #221 | Poor 12.3% |
| Bangladeshis | 10.5 /100 | #222 | Poor 12.3% |