Native/Alaskan vs Immigrants from Afghanistan Divorced or Separated
COMPARE
Native/Alaskan
Immigrants from Afghanistan
Divorced or Separated
Divorced or Separated Comparison
Natives/Alaskans
Immigrants from Afghanistan
13.0%
DIVORCED OR SEPARATED
0.0/ 100
METRIC RATING
297th/ 347
METRIC RANK
11.8%
DIVORCED OR SEPARATED
87.9/ 100
METRIC RATING
132nd/ 347
METRIC RANK
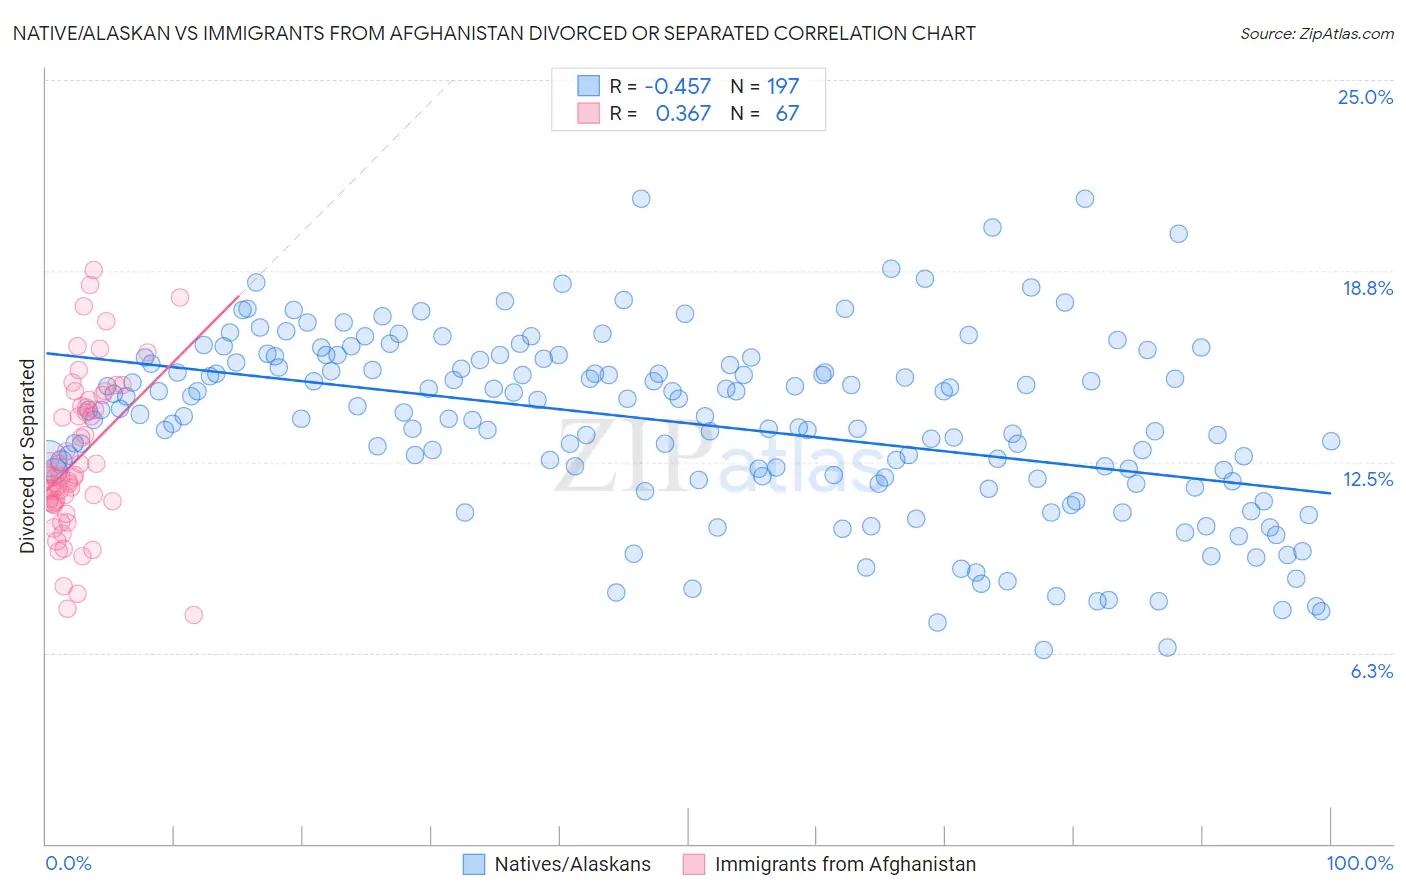
Native/Alaskan vs Immigrants from Afghanistan Divorced or Separated Correlation Chart
The statistical analysis conducted on geographies consisting of 512,782,555 people shows a moderate negative correlation between the proportion of Natives/Alaskans and percentage of population currently divorced or separated in the United States with a correlation coefficient (R) of -0.457 and weighted average of 13.0%. Similarly, the statistical analysis conducted on geographies consisting of 147,642,734 people shows a mild positive correlation between the proportion of Immigrants from Afghanistan and percentage of population currently divorced or separated in the United States with a correlation coefficient (R) of 0.367 and weighted average of 11.8%, a difference of 9.8%.
Divorced or Separated Correlation Summary
| Measurement | Native/Alaskan | Immigrants from Afghanistan |
| Minimum | 6.3% | 7.5% |
| Maximum | 21.1% | 18.8% |
| Range | 14.8% | 11.3% |
| Mean | 13.8% | 12.6% |
| Median | 14.1% | 12.0% |
| Interquartile 25% (IQ1) | 12.0% | 11.2% |
| Interquartile 75% (IQ3) | 15.8% | 14.3% |
| Interquartile Range (IQR) | 3.8% | 3.1% |
| Standard Deviation (Sample) | 2.9% | 2.5% |
| Standard Deviation (Population) | 2.9% | 2.5% |
Similar Demographics by Divorced or Separated
Demographics Similar to Natives/Alaskans by Divorced or Separated
In terms of divorced or separated, the demographic groups most similar to Natives/Alaskans are Nicaraguan (13.0%, a difference of 0.050%), Venezuelan (13.0%, a difference of 0.070%), Immigrants from Jamaica (13.0%, a difference of 0.10%), Celtic (13.0%, a difference of 0.47%), and Apache (12.9%, a difference of 0.60%).
| Demographics | Rating | Rank | Divorced or Separated |
| Pima | 0.0 /100 | #290 | Tragic 12.9% |
| Immigrants | Honduras | 0.0 /100 | #291 | Tragic 12.9% |
| Scotch-Irish | 0.0 /100 | #292 | Tragic 12.9% |
| Jamaicans | 0.0 /100 | #293 | Tragic 12.9% |
| Apache | 0.0 /100 | #294 | Tragic 12.9% |
| Celtics | 0.0 /100 | #295 | Tragic 13.0% |
| Nicaraguans | 0.0 /100 | #296 | Tragic 13.0% |
| Natives/Alaskans | 0.0 /100 | #297 | Tragic 13.0% |
| Venezuelans | 0.0 /100 | #298 | Tragic 13.0% |
| Immigrants | Jamaica | 0.0 /100 | #299 | Tragic 13.0% |
| Immigrants | Cabo Verde | 0.0 /100 | #300 | Tragic 13.1% |
| Alaskan Athabascans | 0.0 /100 | #301 | Tragic 13.1% |
| Immigrants | Venezuela | 0.0 /100 | #302 | Tragic 13.1% |
| Cape Verdeans | 0.0 /100 | #303 | Tragic 13.1% |
| Hopi | 0.0 /100 | #304 | Tragic 13.2% |
Demographics Similar to Immigrants from Afghanistan by Divorced or Separated
In terms of divorced or separated, the demographic groups most similar to Immigrants from Afghanistan are Immigrants from Austria (11.8%, a difference of 0.030%), Immigrants from Cambodia (11.8%, a difference of 0.030%), New Zealander (11.9%, a difference of 0.030%), Immigrants from St. Vincent and the Grenadines (11.8%, a difference of 0.040%), and Immigrants from Ecuador (11.8%, a difference of 0.080%).
| Demographics | Rating | Rank | Divorced or Separated |
| Ukrainians | 92.3 /100 | #125 | Exceptional 11.8% |
| South American Indians | 92.1 /100 | #126 | Exceptional 11.8% |
| South Africans | 88.9 /100 | #127 | Excellent 11.8% |
| Immigrants | Ecuador | 88.9 /100 | #128 | Excellent 11.8% |
| Immigrants | St. Vincent and the Grenadines | 88.4 /100 | #129 | Excellent 11.8% |
| Immigrants | Austria | 88.2 /100 | #130 | Excellent 11.8% |
| Immigrants | Cambodia | 88.2 /100 | #131 | Excellent 11.8% |
| Immigrants | Afghanistan | 87.9 /100 | #132 | Excellent 11.8% |
| New Zealanders | 87.5 /100 | #133 | Excellent 11.9% |
| Argentineans | 85.1 /100 | #134 | Excellent 11.9% |
| Danes | 84.8 /100 | #135 | Excellent 11.9% |
| Carpatho Rusyns | 84.8 /100 | #136 | Excellent 11.9% |
| Alsatians | 84.0 /100 | #137 | Excellent 11.9% |
| Immigrants | Netherlands | 83.9 /100 | #138 | Excellent 11.9% |
| Australians | 83.6 /100 | #139 | Excellent 11.9% |