Native/Alaskan vs Immigrants from Grenada Divorced or Separated
COMPARE
Native/Alaskan
Immigrants from Grenada
Divorced or Separated
Divorced or Separated Comparison
Natives/Alaskans
Immigrants from Grenada
13.0%
DIVORCED OR SEPARATED
0.0/ 100
METRIC RATING
297th/ 347
METRIC RANK
11.9%
DIVORCED OR SEPARATED
79.1/ 100
METRIC RATING
146th/ 347
METRIC RANK
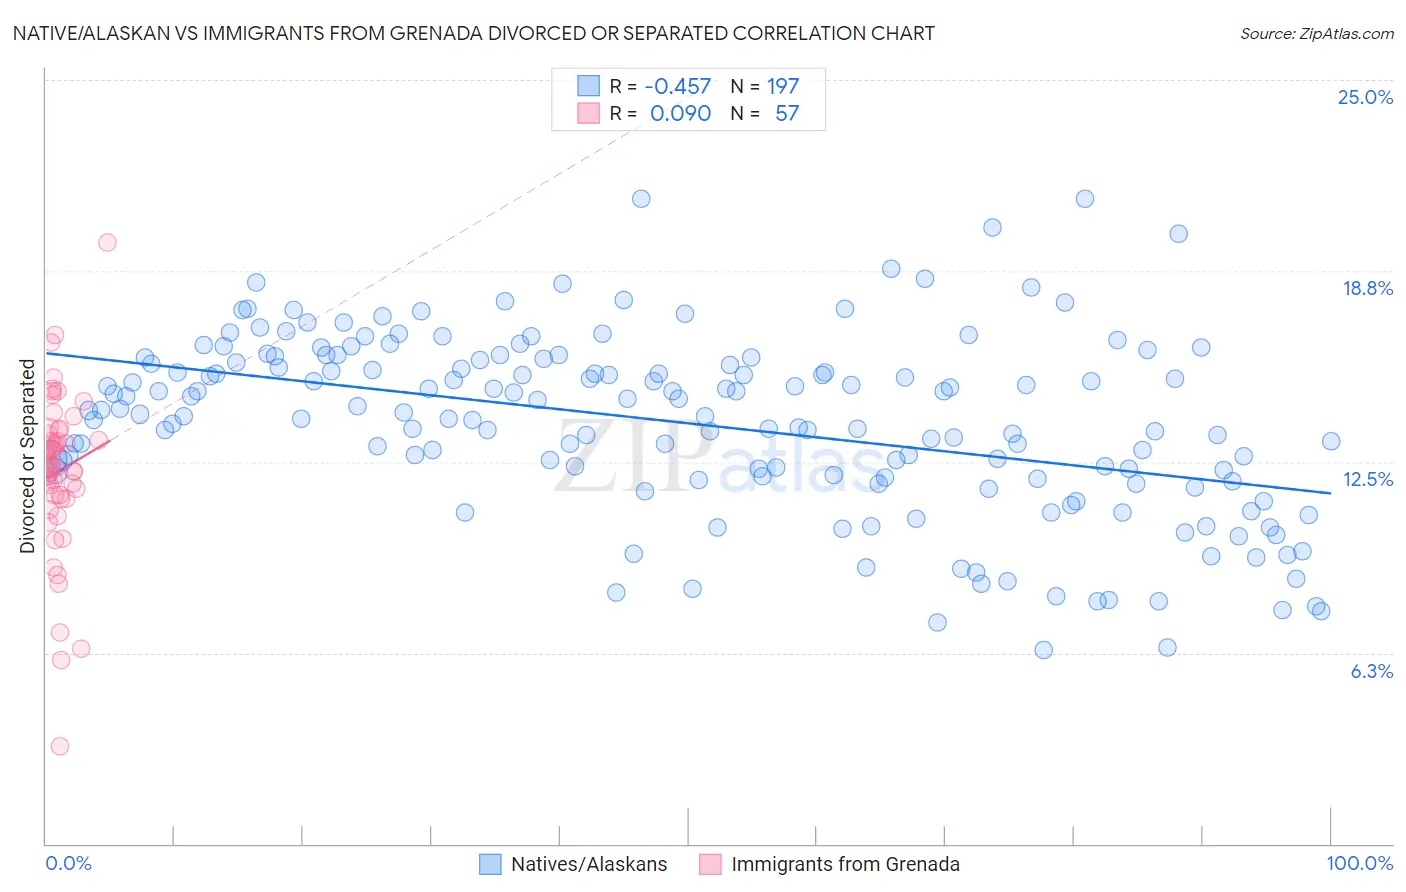
Native/Alaskan vs Immigrants from Grenada Divorced or Separated Correlation Chart
The statistical analysis conducted on geographies consisting of 512,782,555 people shows a moderate negative correlation between the proportion of Natives/Alaskans and percentage of population currently divorced or separated in the United States with a correlation coefficient (R) of -0.457 and weighted average of 13.0%. Similarly, the statistical analysis conducted on geographies consisting of 67,194,278 people shows a slight positive correlation between the proportion of Immigrants from Grenada and percentage of population currently divorced or separated in the United States with a correlation coefficient (R) of 0.090 and weighted average of 11.9%, a difference of 9.2%.
Divorced or Separated Correlation Summary
| Measurement | Native/Alaskan | Immigrants from Grenada |
| Minimum | 6.3% | 3.2% |
| Maximum | 21.1% | 19.7% |
| Range | 14.8% | 16.5% |
| Mean | 13.8% | 12.2% |
| Median | 14.1% | 12.4% |
| Interquartile 25% (IQ1) | 12.0% | 11.3% |
| Interquartile 75% (IQ3) | 15.8% | 13.5% |
| Interquartile Range (IQR) | 3.8% | 2.1% |
| Standard Deviation (Sample) | 2.9% | 2.7% |
| Standard Deviation (Population) | 2.9% | 2.6% |
Similar Demographics by Divorced or Separated
Demographics Similar to Natives/Alaskans by Divorced or Separated
In terms of divorced or separated, the demographic groups most similar to Natives/Alaskans are Nicaraguan (13.0%, a difference of 0.050%), Venezuelan (13.0%, a difference of 0.070%), Immigrants from Jamaica (13.0%, a difference of 0.10%), Celtic (13.0%, a difference of 0.47%), and Apache (12.9%, a difference of 0.60%).
| Demographics | Rating | Rank | Divorced or Separated |
| Pima | 0.0 /100 | #290 | Tragic 12.9% |
| Immigrants | Honduras | 0.0 /100 | #291 | Tragic 12.9% |
| Scotch-Irish | 0.0 /100 | #292 | Tragic 12.9% |
| Jamaicans | 0.0 /100 | #293 | Tragic 12.9% |
| Apache | 0.0 /100 | #294 | Tragic 12.9% |
| Celtics | 0.0 /100 | #295 | Tragic 13.0% |
| Nicaraguans | 0.0 /100 | #296 | Tragic 13.0% |
| Natives/Alaskans | 0.0 /100 | #297 | Tragic 13.0% |
| Venezuelans | 0.0 /100 | #298 | Tragic 13.0% |
| Immigrants | Jamaica | 0.0 /100 | #299 | Tragic 13.0% |
| Immigrants | Cabo Verde | 0.0 /100 | #300 | Tragic 13.1% |
| Alaskan Athabascans | 0.0 /100 | #301 | Tragic 13.1% |
| Immigrants | Venezuela | 0.0 /100 | #302 | Tragic 13.1% |
| Cape Verdeans | 0.0 /100 | #303 | Tragic 13.1% |
| Hopi | 0.0 /100 | #304 | Tragic 13.2% |
Demographics Similar to Immigrants from Grenada by Divorced or Separated
In terms of divorced or separated, the demographic groups most similar to Immigrants from Grenada are Polish (11.9%, a difference of 0.030%), Italian (11.9%, a difference of 0.070%), Immigrants from Oceania (11.9%, a difference of 0.070%), Croatian (11.9%, a difference of 0.080%), and Immigrants from Portugal (11.9%, a difference of 0.090%).
| Demographics | Rating | Rank | Divorced or Separated |
| Australians | 83.6 /100 | #139 | Excellent 11.9% |
| Lebanese | 83.4 /100 | #140 | Excellent 11.9% |
| Immigrants | Morocco | 82.9 /100 | #141 | Excellent 11.9% |
| Immigrants | Zimbabwe | 81.5 /100 | #142 | Excellent 11.9% |
| Pakistanis | 81.3 /100 | #143 | Excellent 11.9% |
| Peruvians | 80.9 /100 | #144 | Excellent 11.9% |
| Croatians | 80.6 /100 | #145 | Excellent 11.9% |
| Immigrants | Grenada | 79.1 /100 | #146 | Good 11.9% |
| Poles | 78.6 /100 | #147 | Good 11.9% |
| Italians | 77.8 /100 | #148 | Good 11.9% |
| Immigrants | Oceania | 77.7 /100 | #149 | Good 11.9% |
| Immigrants | Portugal | 77.3 /100 | #150 | Good 11.9% |
| Czechs | 76.4 /100 | #151 | Good 11.9% |
| Immigrants | Hungary | 73.7 /100 | #152 | Good 11.9% |
| Austrians | 72.2 /100 | #153 | Good 12.0% |