Native/Alaskan vs European Associate's Degree
COMPARE
Native/Alaskan
European
Associate's Degree
Associate's Degree Comparison
Natives/Alaskans
Europeans
34.9%
ASSOCIATE'S DEGREE
0.0/ 100
METRIC RATING
334th/ 347
METRIC RANK
48.2%
ASSOCIATE'S DEGREE
89.0/ 100
METRIC RATING
135th/ 347
METRIC RANK
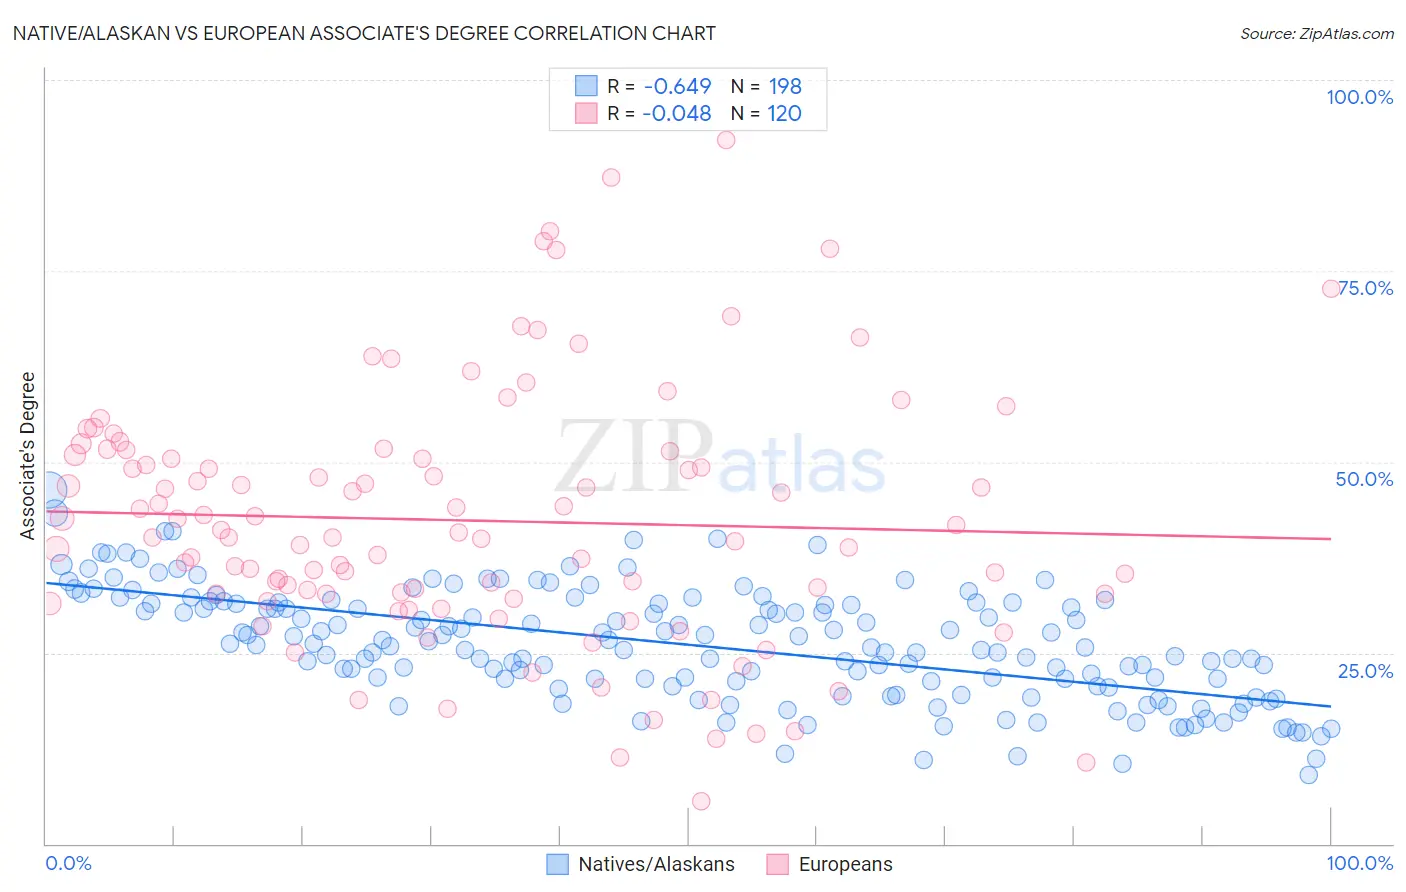
Native/Alaskan vs European Associate's Degree Correlation Chart
The statistical analysis conducted on geographies consisting of 513,021,509 people shows a significant negative correlation between the proportion of Natives/Alaskans and percentage of population with at least associate's degree education in the United States with a correlation coefficient (R) of -0.649 and weighted average of 34.9%. Similarly, the statistical analysis conducted on geographies consisting of 561,753,260 people shows no correlation between the proportion of Europeans and percentage of population with at least associate's degree education in the United States with a correlation coefficient (R) of -0.048 and weighted average of 48.2%, a difference of 38.0%.
Associate's Degree Correlation Summary
| Measurement | Native/Alaskan | European |
| Minimum | 9.1% | 5.6% |
| Maximum | 46.4% | 92.2% |
| Range | 37.3% | 86.6% |
| Mean | 26.1% | 42.3% |
| Median | 26.1% | 40.4% |
| Interquartile 25% (IQ1) | 21.3% | 32.7% |
| Interquartile 75% (IQ3) | 31.5% | 51.2% |
| Interquartile Range (IQR) | 10.2% | 18.5% |
| Standard Deviation (Sample) | 7.2% | 16.5% |
| Standard Deviation (Population) | 7.2% | 16.4% |
Similar Demographics by Associate's Degree
Demographics Similar to Natives/Alaskans by Associate's Degree
In terms of associate's degree, the demographic groups most similar to Natives/Alaskans are Spanish American Indian (34.9%, a difference of 0.14%), Mexican (35.0%, a difference of 0.24%), Immigrants from Central America (35.0%, a difference of 0.31%), Hopi (34.6%, a difference of 1.0%), and Immigrants from the Azores (35.6%, a difference of 2.1%).
| Demographics | Rating | Rank | Associate's Degree |
| Dutch West Indians | 0.0 /100 | #327 | Tragic 36.5% |
| Alaskan Athabascans | 0.0 /100 | #328 | Tragic 36.5% |
| Paiute | 0.0 /100 | #329 | Tragic 36.4% |
| Apache | 0.0 /100 | #330 | Tragic 36.2% |
| Immigrants | Azores | 0.0 /100 | #331 | Tragic 35.6% |
| Immigrants | Central America | 0.0 /100 | #332 | Tragic 35.0% |
| Mexicans | 0.0 /100 | #333 | Tragic 35.0% |
| Natives/Alaskans | 0.0 /100 | #334 | Tragic 34.9% |
| Spanish American Indians | 0.0 /100 | #335 | Tragic 34.9% |
| Hopi | 0.0 /100 | #336 | Tragic 34.6% |
| Lumbee | 0.0 /100 | #337 | Tragic 34.1% |
| Pueblo | 0.0 /100 | #338 | Tragic 34.0% |
| Immigrants | Mexico | 0.0 /100 | #339 | Tragic 33.7% |
| Navajo | 0.0 /100 | #340 | Tragic 32.6% |
| Inupiat | 0.0 /100 | #341 | Tragic 32.6% |
Demographics Similar to Europeans by Associate's Degree
In terms of associate's degree, the demographic groups most similar to Europeans are Moroccan (48.2%, a difference of 0.060%), Assyrian/Chaldean/Syriac (48.2%, a difference of 0.080%), Immigrants from Albania (48.2%, a difference of 0.16%), Pakistani (48.1%, a difference of 0.18%), and Immigrants from Eritrea (48.1%, a difference of 0.22%).
| Demographics | Rating | Rank | Associate's Degree |
| Immigrants | Eastern Africa | 91.6 /100 | #128 | Exceptional 48.4% |
| Swedes | 91.5 /100 | #129 | Exceptional 48.4% |
| Immigrants | Jordan | 91.2 /100 | #130 | Exceptional 48.4% |
| Icelanders | 90.8 /100 | #131 | Exceptional 48.3% |
| Immigrants | Albania | 89.9 /100 | #132 | Excellent 48.2% |
| Assyrians/Chaldeans/Syriacs | 89.4 /100 | #133 | Excellent 48.2% |
| Moroccans | 89.3 /100 | #134 | Excellent 48.2% |
| Europeans | 89.0 /100 | #135 | Excellent 48.2% |
| Pakistanis | 88.0 /100 | #136 | Excellent 48.1% |
| Immigrants | Eritrea | 87.8 /100 | #137 | Excellent 48.1% |
| Poles | 87.3 /100 | #138 | Excellent 48.0% |
| Slovenes | 85.1 /100 | #139 | Excellent 47.9% |
| Immigrants | Southern Europe | 84.4 /100 | #140 | Excellent 47.8% |
| Taiwanese | 83.3 /100 | #141 | Excellent 47.7% |
| Sierra Leoneans | 82.9 /100 | #142 | Excellent 47.7% |