Native/Alaskan vs Immigrants from Moldova Divorced or Separated
COMPARE
Native/Alaskan
Immigrants from Moldova
Divorced or Separated
Divorced or Separated Comparison
Natives/Alaskans
Immigrants from Moldova
13.0%
DIVORCED OR SEPARATED
0.0/ 100
METRIC RATING
297th/ 347
METRIC RANK
12.1%
DIVORCED OR SEPARATED
50.4/ 100
METRIC RATING
173rd/ 347
METRIC RANK
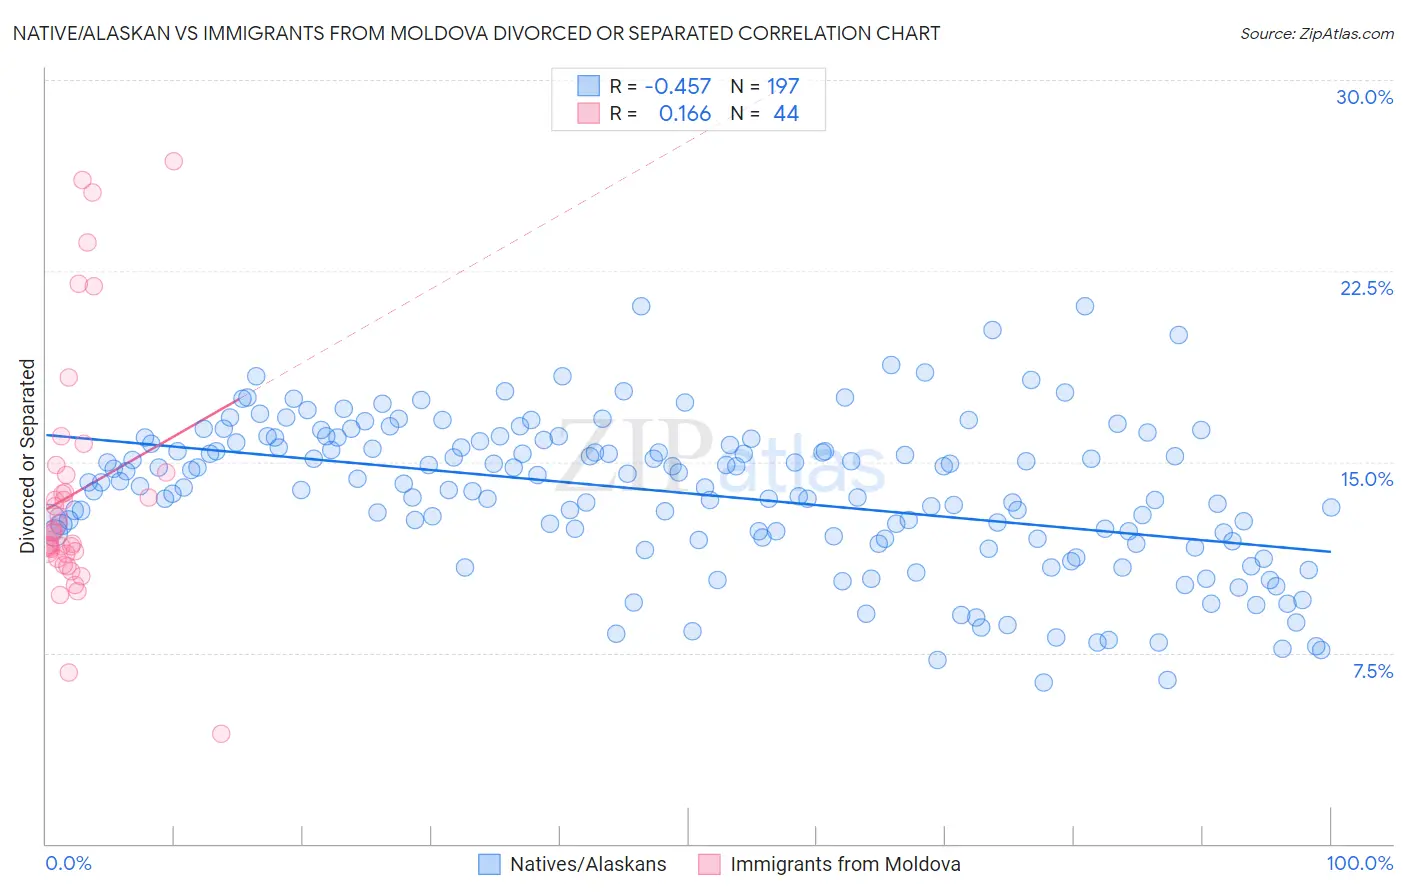
Native/Alaskan vs Immigrants from Moldova Divorced or Separated Correlation Chart
The statistical analysis conducted on geographies consisting of 512,782,555 people shows a moderate negative correlation between the proportion of Natives/Alaskans and percentage of population currently divorced or separated in the United States with a correlation coefficient (R) of -0.457 and weighted average of 13.0%. Similarly, the statistical analysis conducted on geographies consisting of 124,391,086 people shows a poor positive correlation between the proportion of Immigrants from Moldova and percentage of population currently divorced or separated in the United States with a correlation coefficient (R) of 0.166 and weighted average of 12.1%, a difference of 7.9%.
Divorced or Separated Correlation Summary
| Measurement | Native/Alaskan | Immigrants from Moldova |
| Minimum | 6.3% | 4.3% |
| Maximum | 21.1% | 26.8% |
| Range | 14.8% | 22.5% |
| Mean | 13.8% | 13.8% |
| Median | 14.1% | 12.2% |
| Interquartile 25% (IQ1) | 12.0% | 11.4% |
| Interquartile 75% (IQ3) | 15.8% | 14.5% |
| Interquartile Range (IQR) | 3.8% | 3.2% |
| Standard Deviation (Sample) | 2.9% | 4.8% |
| Standard Deviation (Population) | 2.9% | 4.8% |
Similar Demographics by Divorced or Separated
Demographics Similar to Natives/Alaskans by Divorced or Separated
In terms of divorced or separated, the demographic groups most similar to Natives/Alaskans are Nicaraguan (13.0%, a difference of 0.050%), Venezuelan (13.0%, a difference of 0.070%), Immigrants from Jamaica (13.0%, a difference of 0.10%), Celtic (13.0%, a difference of 0.47%), and Apache (12.9%, a difference of 0.60%).
| Demographics | Rating | Rank | Divorced or Separated |
| Pima | 0.0 /100 | #290 | Tragic 12.9% |
| Immigrants | Honduras | 0.0 /100 | #291 | Tragic 12.9% |
| Scotch-Irish | 0.0 /100 | #292 | Tragic 12.9% |
| Jamaicans | 0.0 /100 | #293 | Tragic 12.9% |
| Apache | 0.0 /100 | #294 | Tragic 12.9% |
| Celtics | 0.0 /100 | #295 | Tragic 13.0% |
| Nicaraguans | 0.0 /100 | #296 | Tragic 13.0% |
| Natives/Alaskans | 0.0 /100 | #297 | Tragic 13.0% |
| Venezuelans | 0.0 /100 | #298 | Tragic 13.0% |
| Immigrants | Jamaica | 0.0 /100 | #299 | Tragic 13.0% |
| Immigrants | Cabo Verde | 0.0 /100 | #300 | Tragic 13.1% |
| Alaskan Athabascans | 0.0 /100 | #301 | Tragic 13.1% |
| Immigrants | Venezuela | 0.0 /100 | #302 | Tragic 13.1% |
| Cape Verdeans | 0.0 /100 | #303 | Tragic 13.1% |
| Hopi | 0.0 /100 | #304 | Tragic 13.2% |
Demographics Similar to Immigrants from Moldova by Divorced or Separated
In terms of divorced or separated, the demographic groups most similar to Immigrants from Moldova are Hawaiian (12.1%, a difference of 0.020%), Immigrants from Sierra Leone (12.1%, a difference of 0.020%), Pennsylvania German (12.1%, a difference of 0.050%), Immigrants from Mexico (12.0%, a difference of 0.090%), and Brazilian (12.1%, a difference of 0.090%).
| Demographics | Rating | Rank | Divorced or Separated |
| Tohono O'odham | 60.4 /100 | #166 | Good 12.0% |
| Ethiopians | 58.5 /100 | #167 | Average 12.0% |
| Serbians | 57.1 /100 | #168 | Average 12.0% |
| Immigrants | Peru | 57.0 /100 | #169 | Average 12.0% |
| Mexican American Indians | 55.8 /100 | #170 | Average 12.0% |
| Costa Ricans | 53.3 /100 | #171 | Average 12.0% |
| Immigrants | Mexico | 53.2 /100 | #172 | Average 12.0% |
| Immigrants | Moldova | 50.4 /100 | #173 | Average 12.1% |
| Hawaiians | 50.0 /100 | #174 | Average 12.1% |
| Immigrants | Sierra Leone | 50.0 /100 | #175 | Average 12.1% |
| Pennsylvania Germans | 48.9 /100 | #176 | Average 12.1% |
| Brazilians | 47.7 /100 | #177 | Average 12.1% |
| Ghanaians | 45.9 /100 | #178 | Average 12.1% |
| Immigrants | Western Europe | 45.6 /100 | #179 | Average 12.1% |
| Barbadians | 45.0 /100 | #180 | Average 12.1% |