Palestinian vs Dutch Births to Unmarried Women
COMPARE
Palestinian
Dutch
Births to Unmarried Women
Births to Unmarried Women Comparison
Palestinians
Dutch
28.4%
BIRTHS TO UNMARRIED WOMEN
98.7/ 100
METRIC RATING
67th/ 347
METRIC RANK
31.5%
BIRTHS TO UNMARRIED WOMEN
55.3/ 100
METRIC RATING
167th/ 347
METRIC RANK
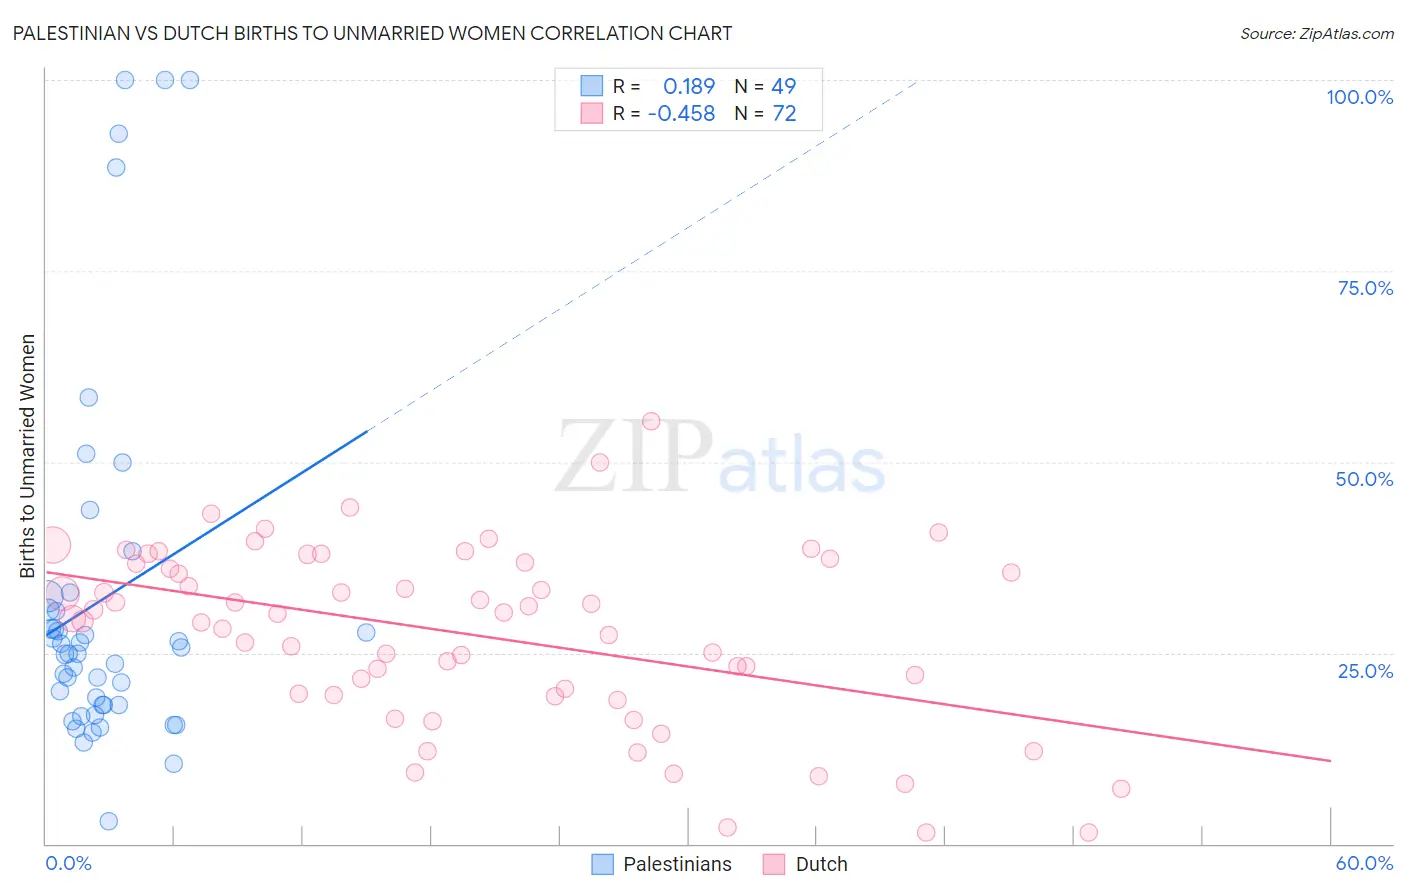
Palestinian vs Dutch Births to Unmarried Women Correlation Chart
The statistical analysis conducted on geographies consisting of 207,464,489 people shows a poor positive correlation between the proportion of Palestinians and percentage of births to unmarried women in the United States with a correlation coefficient (R) of 0.189 and weighted average of 28.4%. Similarly, the statistical analysis conducted on geographies consisting of 493,194,115 people shows a moderate negative correlation between the proportion of Dutch and percentage of births to unmarried women in the United States with a correlation coefficient (R) of -0.458 and weighted average of 31.5%, a difference of 10.8%.
Births to Unmarried Women Correlation Summary
| Measurement | Palestinian | Dutch |
| Minimum | 2.9% | 1.4% |
| Maximum | 100.0% | 55.3% |
| Range | 97.1% | 53.9% |
| Mean | 32.1% | 27.5% |
| Median | 24.9% | 29.8% |
| Interquartile 25% (IQ1) | 18.1% | 19.6% |
| Interquartile 75% (IQ3) | 31.6% | 36.7% |
| Interquartile Range (IQR) | 13.5% | 17.2% |
| Standard Deviation (Sample) | 24.2% | 11.7% |
| Standard Deviation (Population) | 23.9% | 11.6% |
Similar Demographics by Births to Unmarried Women
Demographics Similar to Palestinians by Births to Unmarried Women
In terms of births to unmarried women, the demographic groups most similar to Palestinians are Immigrants from Europe (28.4%, a difference of 0.050%), Bolivian (28.5%, a difference of 0.090%), Immigrants from Egypt (28.4%, a difference of 0.11%), Immigrants from Czechoslovakia (28.4%, a difference of 0.13%), and Tongan (28.4%, a difference of 0.15%).
| Demographics | Rating | Rank | Births to Unmarried Women |
| Immigrants | Turkey | 99.1 /100 | #60 | Exceptional 28.1% |
| Immigrants | North Macedonia | 99.1 /100 | #61 | Exceptional 28.1% |
| Egyptians | 99.0 /100 | #62 | Exceptional 28.2% |
| Immigrants | Serbia | 98.9 /100 | #63 | Exceptional 28.3% |
| Tongans | 98.8 /100 | #64 | Exceptional 28.4% |
| Immigrants | Czechoslovakia | 98.8 /100 | #65 | Exceptional 28.4% |
| Immigrants | Egypt | 98.8 /100 | #66 | Exceptional 28.4% |
| Palestinians | 98.7 /100 | #67 | Exceptional 28.4% |
| Immigrants | Europe | 98.7 /100 | #68 | Exceptional 28.4% |
| Bolivians | 98.7 /100 | #69 | Exceptional 28.5% |
| Laotians | 98.6 /100 | #70 | Exceptional 28.5% |
| Jordanians | 98.5 /100 | #71 | Exceptional 28.5% |
| Immigrants | Sweden | 98.5 /100 | #72 | Exceptional 28.5% |
| Albanians | 98.5 /100 | #73 | Exceptional 28.5% |
| Immigrants | Bolivia | 98.5 /100 | #74 | Exceptional 28.6% |
Demographics Similar to Dutch by Births to Unmarried Women
In terms of births to unmarried women, the demographic groups most similar to Dutch are Peruvian (31.5%, a difference of 0.030%), Belgian (31.6%, a difference of 0.27%), Immigrants from Somalia (31.4%, a difference of 0.28%), Slavic (31.6%, a difference of 0.31%), and Guamanian/Chamorro (31.6%, a difference of 0.38%).
| Demographics | Rating | Rank | Births to Unmarried Women |
| Immigrants | Western Europe | 69.3 /100 | #160 | Good 31.1% |
| Immigrants | Southern Europe | 68.7 /100 | #161 | Good 31.1% |
| Slovenes | 65.9 /100 | #162 | Good 31.2% |
| Immigrants | Chile | 65.7 /100 | #163 | Good 31.2% |
| Hungarians | 64.1 /100 | #164 | Good 31.2% |
| Immigrants | Somalia | 58.1 /100 | #165 | Average 31.4% |
| Peruvians | 55.5 /100 | #166 | Average 31.5% |
| Dutch | 55.3 /100 | #167 | Average 31.5% |
| Belgians | 52.4 /100 | #168 | Average 31.6% |
| Slavs | 52.0 /100 | #169 | Average 31.6% |
| Guamanians/Chamorros | 51.3 /100 | #170 | Average 31.6% |
| Finns | 50.5 /100 | #171 | Average 31.7% |
| Immigrants | Eritrea | 50.4 /100 | #172 | Average 31.7% |
| Immigrants | Yemen | 50.2 /100 | #173 | Average 31.7% |
| Venezuelans | 50.0 /100 | #174 | Average 31.7% |