Native/Alaskan vs Dutch Disability Age Under 5
COMPARE
Native/Alaskan
Dutch
Disability Age Under 5
Disability Age Under 5 Comparison
Natives/Alaskans
Dutch
1.9%
DISABILITY AGE UNDER 5
0.0/ 100
METRIC RATING
334th/ 347
METRIC RANK
1.7%
DISABILITY AGE UNDER 5
0.0/ 100
METRIC RATING
315th/ 347
METRIC RANK
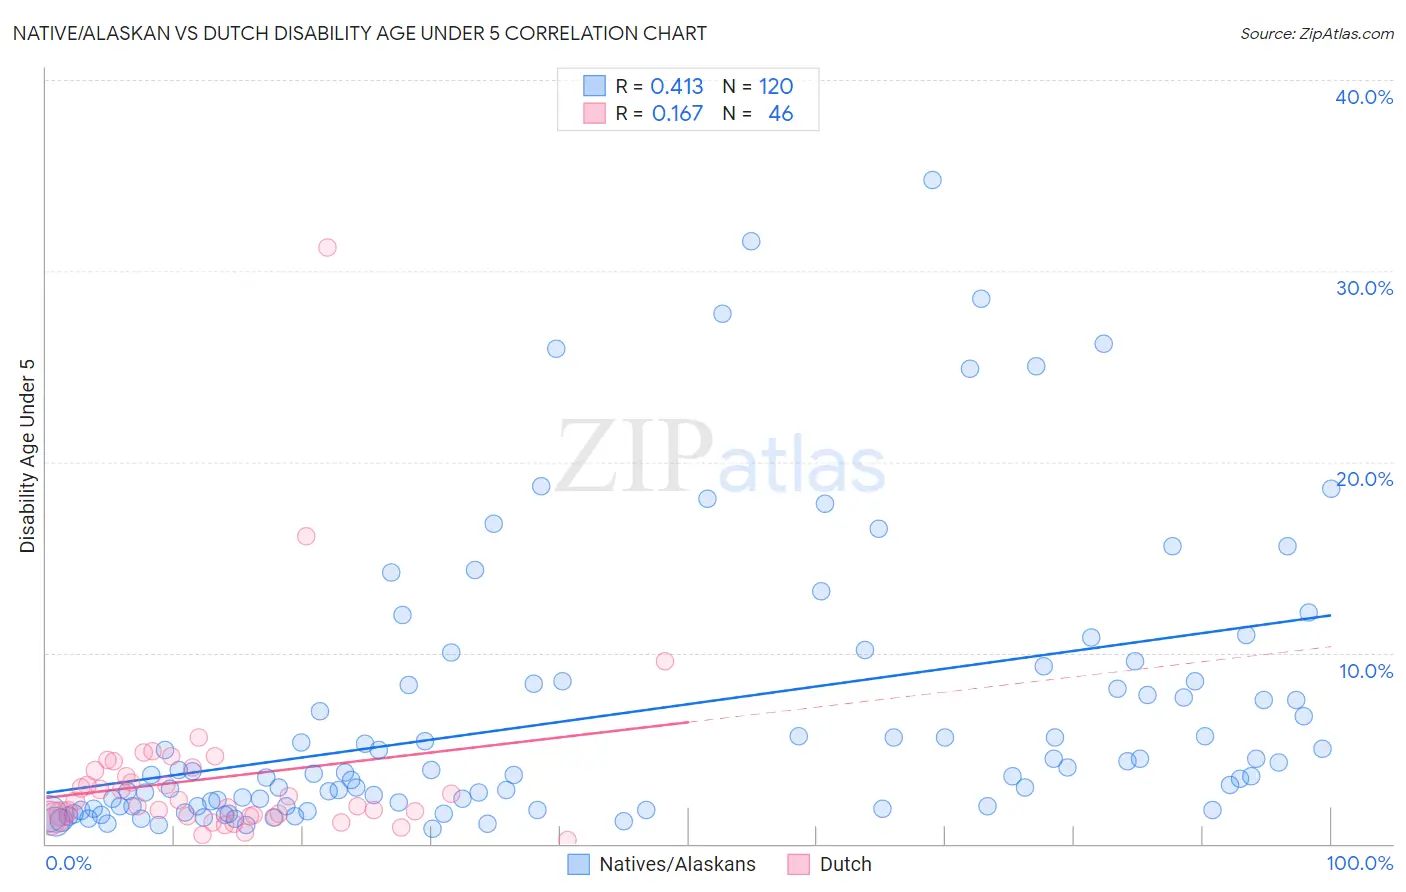
Native/Alaskan vs Dutch Disability Age Under 5 Correlation Chart
The statistical analysis conducted on geographies consisting of 253,755,946 people shows a moderate positive correlation between the proportion of Natives/Alaskans and percentage of population with a disability under the age of 5 in the United States with a correlation coefficient (R) of 0.413 and weighted average of 1.9%. Similarly, the statistical analysis conducted on geographies consisting of 256,007,977 people shows a poor positive correlation between the proportion of Dutch and percentage of population with a disability under the age of 5 in the United States with a correlation coefficient (R) of 0.167 and weighted average of 1.7%, a difference of 15.6%.
Disability Age Under 5 Correlation Summary
| Measurement | Native/Alaskan | Dutch |
| Minimum | 0.79% | 0.18% |
| Maximum | 34.8% | 31.2% |
| Range | 34.0% | 31.1% |
| Mean | 6.7% | 3.5% |
| Median | 3.6% | 2.1% |
| Interquartile 25% (IQ1) | 2.0% | 1.5% |
| Interquartile 75% (IQ3) | 8.4% | 3.8% |
| Interquartile Range (IQR) | 6.4% | 2.4% |
| Standard Deviation (Sample) | 7.3% | 4.9% |
| Standard Deviation (Population) | 7.3% | 4.9% |
Demographics Similar to Natives/Alaskans and Dutch by Disability Age Under 5
In terms of disability age under 5, the demographic groups most similar to Natives/Alaskans are Dutch West Indian (1.9%, a difference of 0.40%), Chippewa (1.9%, a difference of 3.4%), French Canadian (1.9%, a difference of 3.4%), Choctaw (1.9%, a difference of 3.7%), and Houma (1.9%, a difference of 4.1%). Similarly, the demographic groups most similar to Dutch are Immigrants from Cabo Verde (1.7%, a difference of 0.18%), Norwegian (1.7%, a difference of 0.26%), French (1.7%, a difference of 0.61%), Irish (1.7%, a difference of 0.88%), and Slovak (1.7%, a difference of 1.2%).
| Demographics | Rating | Rank | Disability Age Under 5 |
| Norwegians | 0.0 /100 | #314 | Tragic 1.7% |
| Dutch | 0.0 /100 | #315 | Tragic 1.7% |
| Immigrants | Cabo Verde | 0.0 /100 | #316 | Tragic 1.7% |
| French | 0.0 /100 | #317 | Tragic 1.7% |
| Irish | 0.0 /100 | #318 | Tragic 1.7% |
| Slovaks | 0.0 /100 | #319 | Tragic 1.7% |
| Scotch-Irish | 0.0 /100 | #320 | Tragic 1.7% |
| Ottawa | 0.0 /100 | #321 | Tragic 1.7% |
| Germans | 0.0 /100 | #322 | Tragic 1.7% |
| Chickasaw | 0.0 /100 | #323 | Tragic 1.7% |
| Cherokee | 0.0 /100 | #324 | Tragic 1.8% |
| Immigrants | Portugal | 0.0 /100 | #325 | Tragic 1.8% |
| Sioux | 0.0 /100 | #326 | Tragic 1.8% |
| Osage | 0.0 /100 | #327 | Tragic 1.8% |
| Americans | 0.0 /100 | #328 | Tragic 1.9% |
| Houma | 0.0 /100 | #329 | Tragic 1.9% |
| Choctaw | 0.0 /100 | #330 | Tragic 1.9% |
| French Canadians | 0.0 /100 | #331 | Tragic 1.9% |
| Chippewa | 0.0 /100 | #332 | Tragic 1.9% |
| Dutch West Indians | 0.0 /100 | #333 | Tragic 1.9% |
| Natives/Alaskans | 0.0 /100 | #334 | Tragic 1.9% |