Native/Alaskan vs Dutch Bachelor's Degree
COMPARE
Native/Alaskan
Dutch
Bachelor's Degree
Bachelor's Degree Comparison
Natives/Alaskans
Dutch
26.3%
BACHELOR'S DEGREE
0.0/ 100
METRIC RATING
335th/ 347
METRIC RANK
35.7%
BACHELOR'S DEGREE
9.2/ 100
METRIC RATING
221st/ 347
METRIC RANK
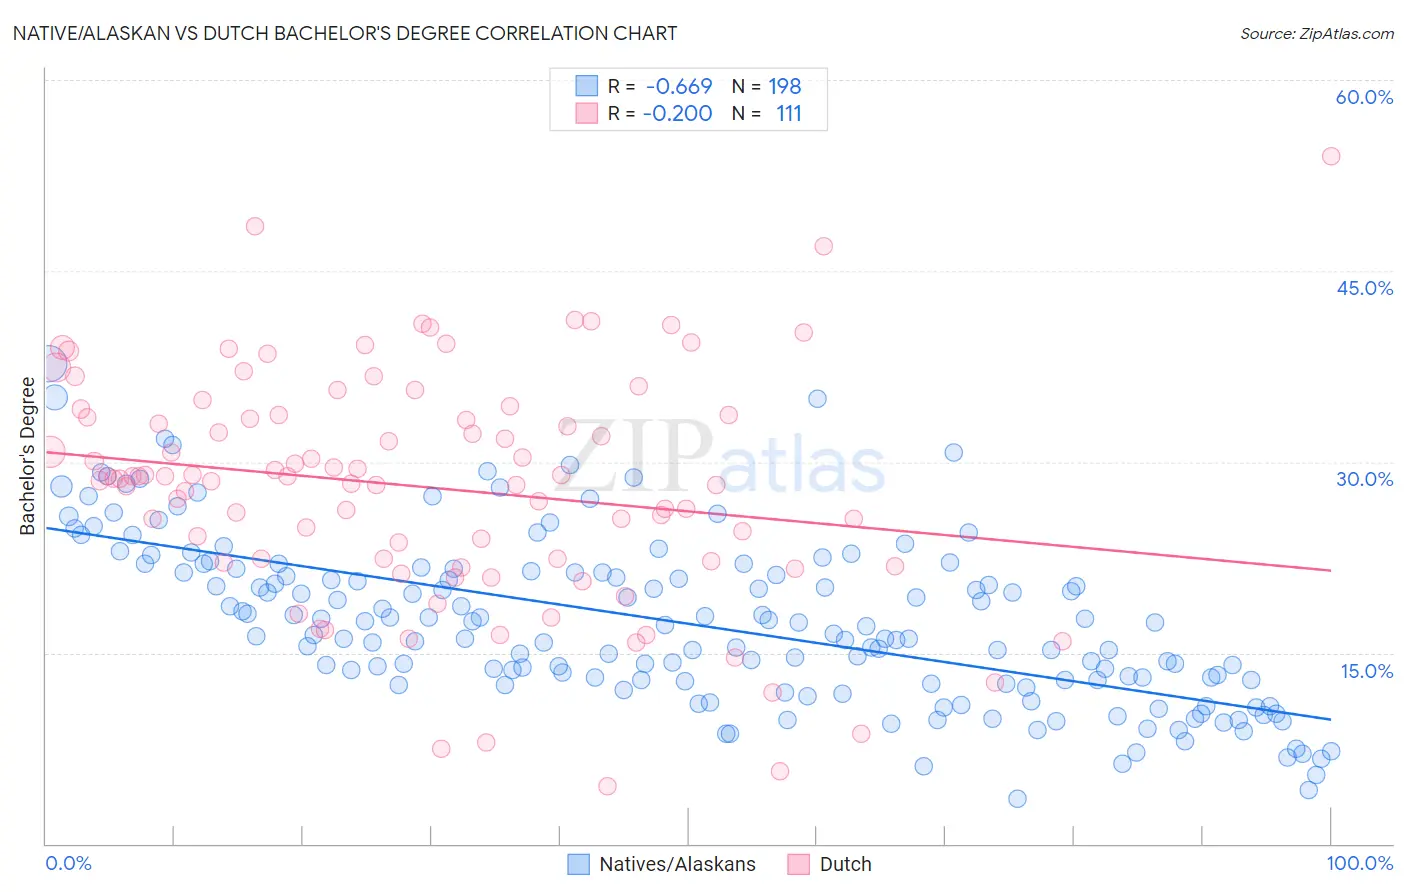
Native/Alaskan vs Dutch Bachelor's Degree Correlation Chart
The statistical analysis conducted on geographies consisting of 512,966,883 people shows a significant negative correlation between the proportion of Natives/Alaskans and percentage of population with at least bachelor's degree education in the United States with a correlation coefficient (R) of -0.669 and weighted average of 26.3%. Similarly, the statistical analysis conducted on geographies consisting of 554,248,334 people shows a weak negative correlation between the proportion of Dutch and percentage of population with at least bachelor's degree education in the United States with a correlation coefficient (R) of -0.200 and weighted average of 35.7%, a difference of 35.7%.
Bachelor's Degree Correlation Summary
| Measurement | Native/Alaskan | Dutch |
| Minimum | 3.5% | 4.5% |
| Maximum | 37.7% | 54.1% |
| Range | 34.2% | 49.5% |
| Mean | 17.3% | 28.0% |
| Median | 16.5% | 28.7% |
| Interquartile 25% (IQ1) | 12.7% | 22.2% |
| Interquartile 75% (IQ3) | 21.3% | 33.7% |
| Interquartile Range (IQR) | 8.6% | 11.4% |
| Standard Deviation (Sample) | 6.5% | 9.1% |
| Standard Deviation (Population) | 6.5% | 9.0% |
Similar Demographics by Bachelor's Degree
Demographics Similar to Natives/Alaskans by Bachelor's Degree
In terms of bachelor's degree, the demographic groups most similar to Natives/Alaskans are Immigrants from Mexico (26.1%, a difference of 0.70%), Arapaho (26.6%, a difference of 1.1%), Inupiat (25.8%, a difference of 2.0%), Mexican (27.1%, a difference of 2.9%), and Pueblo (25.5%, a difference of 3.1%).
| Demographics | Rating | Rank | Bachelor's Degree |
| Crow | 0.0 /100 | #328 | Tragic 27.7% |
| Immigrants | Central America | 0.0 /100 | #329 | Tragic 27.5% |
| Spanish American Indians | 0.0 /100 | #330 | Tragic 27.5% |
| Immigrants | Azores | 0.0 /100 | #331 | Tragic 27.3% |
| Menominee | 0.0 /100 | #332 | Tragic 27.3% |
| Mexicans | 0.0 /100 | #333 | Tragic 27.1% |
| Arapaho | 0.0 /100 | #334 | Tragic 26.6% |
| Natives/Alaskans | 0.0 /100 | #335 | Tragic 26.3% |
| Immigrants | Mexico | 0.0 /100 | #336 | Tragic 26.1% |
| Inupiat | 0.0 /100 | #337 | Tragic 25.8% |
| Pueblo | 0.0 /100 | #338 | Tragic 25.5% |
| Hopi | 0.0 /100 | #339 | Tragic 25.3% |
| Lumbee | 0.0 /100 | #340 | Tragic 24.8% |
| Yuman | 0.0 /100 | #341 | Tragic 24.5% |
| Yakama | 0.0 /100 | #342 | Tragic 24.5% |
Demographics Similar to Dutch by Bachelor's Degree
In terms of bachelor's degree, the demographic groups most similar to Dutch are Spanish (35.8%, a difference of 0.11%), Trinidadian and Tobagonian (35.7%, a difference of 0.14%), West Indian (35.8%, a difference of 0.15%), Subsaharan African (35.8%, a difference of 0.18%), and German Russian (35.8%, a difference of 0.28%).
| Demographics | Rating | Rank | Bachelor's Degree |
| Germans | 13.9 /100 | #214 | Poor 36.1% |
| Immigrants | Western Africa | 13.8 /100 | #215 | Poor 36.1% |
| Barbadians | 13.5 /100 | #216 | Poor 36.1% |
| German Russians | 10.2 /100 | #217 | Poor 35.8% |
| Sub-Saharan Africans | 9.8 /100 | #218 | Tragic 35.8% |
| West Indians | 9.7 /100 | #219 | Tragic 35.8% |
| Spanish | 9.6 /100 | #220 | Tragic 35.8% |
| Dutch | 9.2 /100 | #221 | Tragic 35.7% |
| Trinidadians and Tobagonians | 8.8 /100 | #222 | Tragic 35.7% |
| French Canadians | 8.3 /100 | #223 | Tragic 35.6% |
| Immigrants | Barbados | 7.5 /100 | #224 | Tragic 35.5% |
| Immigrants | Burma/Myanmar | 7.3 /100 | #225 | Tragic 35.5% |
| Portuguese | 7.2 /100 | #226 | Tragic 35.5% |
| Ecuadorians | 6.6 /100 | #227 | Tragic 35.4% |
| Immigrants | Trinidad and Tobago | 6.0 /100 | #228 | Tragic 35.3% |