Liberian vs Chippewa Births to Unmarried Women
COMPARE
Liberian
Chippewa
Births to Unmarried Women
Births to Unmarried Women Comparison
Liberians
Chippewa
37.4%
BIRTHS TO UNMARRIED WOMEN
0.0/ 100
METRIC RATING
282nd/ 347
METRIC RANK
42.6%
BIRTHS TO UNMARRIED WOMEN
0.0/ 100
METRIC RATING
330th/ 347
METRIC RANK
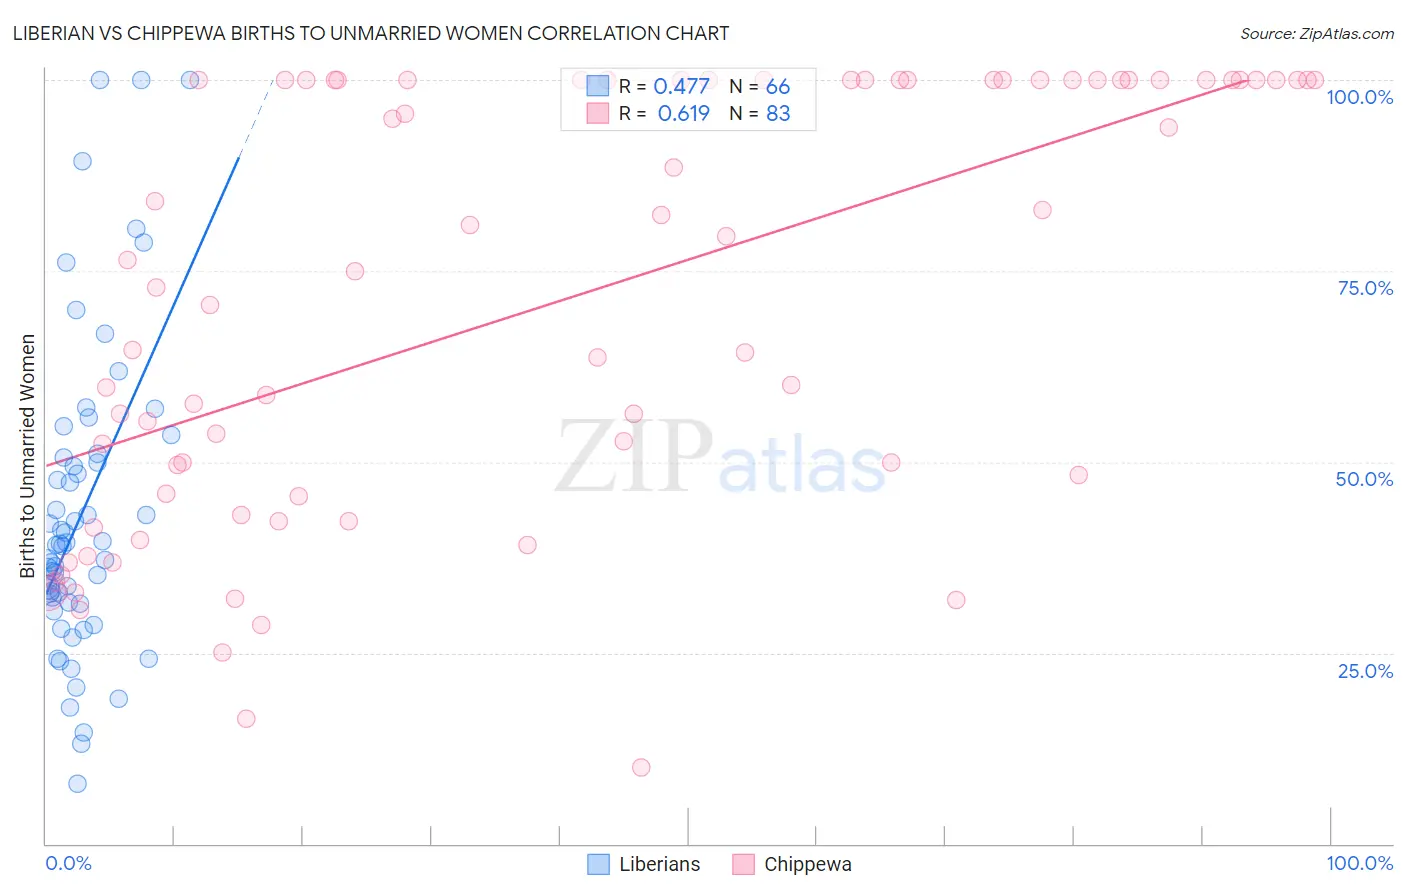
Liberian vs Chippewa Births to Unmarried Women Correlation Chart
The statistical analysis conducted on geographies consisting of 116,121,082 people shows a moderate positive correlation between the proportion of Liberians and percentage of births to unmarried women in the United States with a correlation coefficient (R) of 0.477 and weighted average of 37.4%. Similarly, the statistical analysis conducted on geographies consisting of 205,326,129 people shows a significant positive correlation between the proportion of Chippewa and percentage of births to unmarried women in the United States with a correlation coefficient (R) of 0.619 and weighted average of 42.6%, a difference of 14.0%.
Births to Unmarried Women Correlation Summary
| Measurement | Liberian | Chippewa |
| Minimum | 7.8% | 10.0% |
| Maximum | 100.0% | 100.0% |
| Range | 92.2% | 90.0% |
| Mean | 43.2% | 71.0% |
| Median | 39.0% | 75.0% |
| Interquartile 25% (IQ1) | 31.6% | 45.5% |
| Interquartile 75% (IQ3) | 50.5% | 100.0% |
| Interquartile Range (IQR) | 18.9% | 54.5% |
| Standard Deviation (Sample) | 20.4% | 27.9% |
| Standard Deviation (Population) | 20.2% | 27.7% |
Similar Demographics by Births to Unmarried Women
Demographics Similar to Liberians by Births to Unmarried Women
In terms of births to unmarried women, the demographic groups most similar to Liberians are Spanish American Indian (37.4%, a difference of 0.080%), Immigrants from Central America (37.4%, a difference of 0.14%), Immigrants from Belize (37.3%, a difference of 0.17%), Immigrants from St. Vincent and the Grenadines (37.3%, a difference of 0.18%), and Immigrants from Mexico (37.5%, a difference of 0.24%).
| Demographics | Rating | Rank | Births to Unmarried Women |
| Barbadians | 0.1 /100 | #275 | Tragic 37.0% |
| Belizeans | 0.1 /100 | #276 | Tragic 37.0% |
| Guatemalans | 0.1 /100 | #277 | Tragic 37.1% |
| Immigrants | Latin America | 0.1 /100 | #278 | Tragic 37.1% |
| West Indians | 0.1 /100 | #279 | Tragic 37.3% |
| Immigrants | St. Vincent and the Grenadines | 0.1 /100 | #280 | Tragic 37.3% |
| Immigrants | Belize | 0.1 /100 | #281 | Tragic 37.3% |
| Liberians | 0.0 /100 | #282 | Tragic 37.4% |
| Spanish American Indians | 0.0 /100 | #283 | Tragic 37.4% |
| Immigrants | Central America | 0.0 /100 | #284 | Tragic 37.4% |
| Immigrants | Mexico | 0.0 /100 | #285 | Tragic 37.5% |
| Immigrants | Guatemala | 0.0 /100 | #286 | Tragic 37.5% |
| Creek | 0.0 /100 | #287 | Tragic 37.6% |
| Immigrants | Liberia | 0.0 /100 | #288 | Tragic 37.6% |
| Alaskan Athabascans | 0.0 /100 | #289 | Tragic 37.7% |
Demographics Similar to Chippewa by Births to Unmarried Women
In terms of births to unmarried women, the demographic groups most similar to Chippewa are Paiute (42.5%, a difference of 0.40%), Native/Alaskan (43.0%, a difference of 0.83%), Immigrants from Cabo Verde (42.2%, a difference of 1.0%), Tsimshian (42.2%, a difference of 1.1%), and Kiowa (43.1%, a difference of 1.2%).
| Demographics | Rating | Rank | Births to Unmarried Women |
| Sioux | 0.0 /100 | #323 | Tragic 41.0% |
| Cape Verdeans | 0.0 /100 | #324 | Tragic 41.3% |
| Cheyenne | 0.0 /100 | #325 | Tragic 41.3% |
| Immigrants | Cuba | 0.0 /100 | #326 | Tragic 41.5% |
| Tsimshian | 0.0 /100 | #327 | Tragic 42.2% |
| Immigrants | Cabo Verde | 0.0 /100 | #328 | Tragic 42.2% |
| Paiute | 0.0 /100 | #329 | Tragic 42.5% |
| Chippewa | 0.0 /100 | #330 | Tragic 42.6% |
| Natives/Alaskans | 0.0 /100 | #331 | Tragic 43.0% |
| Kiowa | 0.0 /100 | #332 | Tragic 43.1% |
| Blacks/African Americans | 0.0 /100 | #333 | Tragic 44.3% |
| Yuman | 0.0 /100 | #334 | Tragic 44.4% |
| Colville | 0.0 /100 | #335 | Tragic 45.3% |
| Puerto Ricans | 0.0 /100 | #336 | Tragic 45.7% |
| Houma | 0.0 /100 | #337 | Tragic 46.6% |