Liberian vs Central American Births to Unmarried Women
COMPARE
Liberian
Central American
Births to Unmarried Women
Births to Unmarried Women Comparison
Liberians
Central Americans
37.4%
BIRTHS TO UNMARRIED WOMEN
0.0/ 100
METRIC RATING
282nd/ 347
METRIC RANK
36.7%
BIRTHS TO UNMARRIED WOMEN
0.1/ 100
METRIC RATING
267th/ 347
METRIC RANK
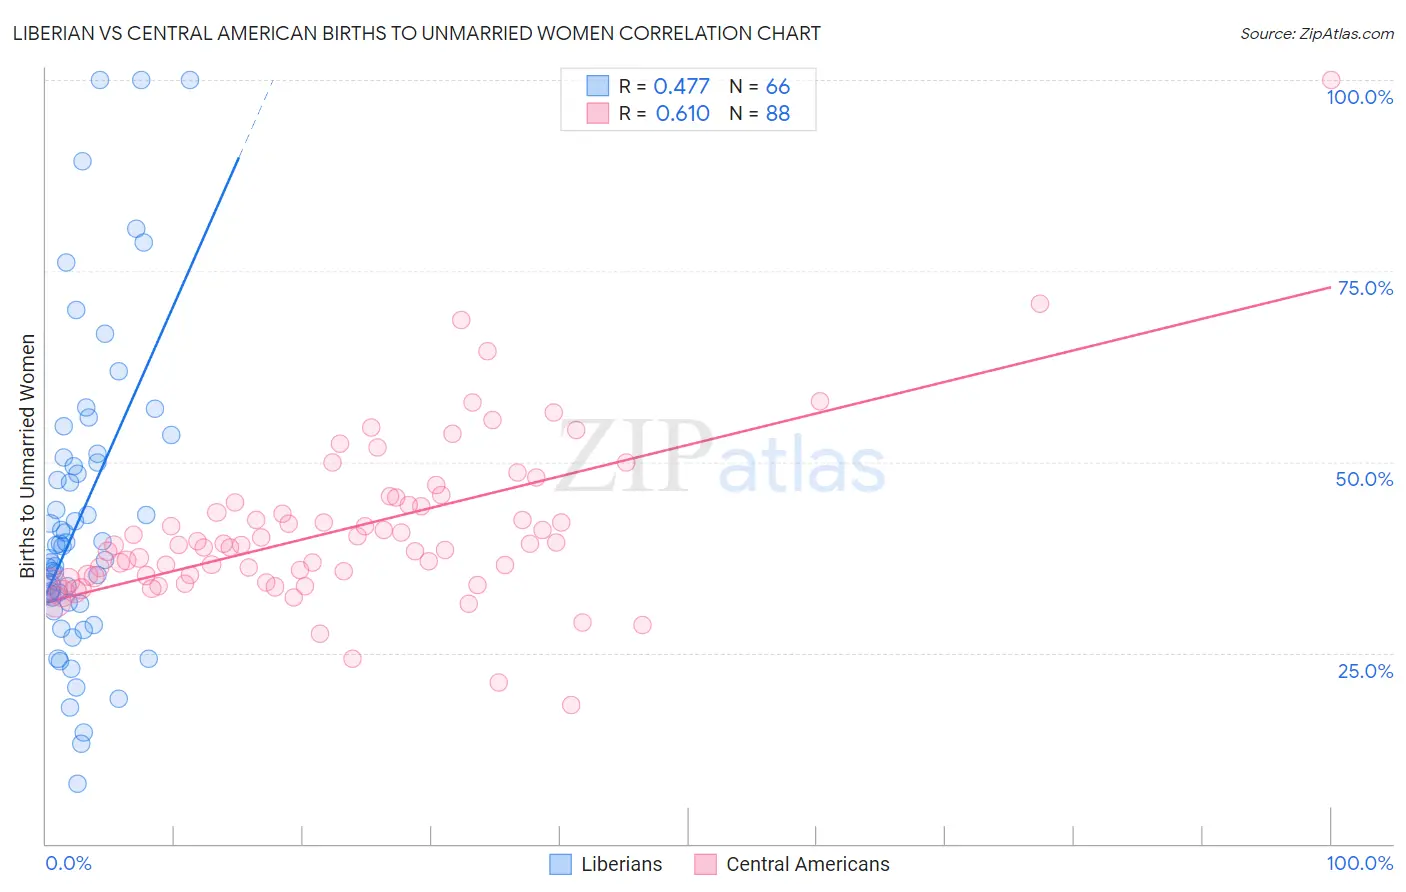
Liberian vs Central American Births to Unmarried Women Correlation Chart
The statistical analysis conducted on geographies consisting of 116,121,082 people shows a moderate positive correlation between the proportion of Liberians and percentage of births to unmarried women in the United States with a correlation coefficient (R) of 0.477 and weighted average of 37.4%. Similarly, the statistical analysis conducted on geographies consisting of 464,543,910 people shows a significant positive correlation between the proportion of Central Americans and percentage of births to unmarried women in the United States with a correlation coefficient (R) of 0.610 and weighted average of 36.7%, a difference of 1.8%.
Births to Unmarried Women Correlation Summary
| Measurement | Liberian | Central American |
| Minimum | 7.8% | 18.1% |
| Maximum | 100.0% | 100.0% |
| Range | 92.2% | 81.9% |
| Mean | 43.2% | 41.3% |
| Median | 39.0% | 39.1% |
| Interquartile 25% (IQ1) | 31.6% | 35.0% |
| Interquartile 75% (IQ3) | 50.5% | 44.6% |
| Interquartile Range (IQR) | 18.9% | 9.5% |
| Standard Deviation (Sample) | 20.4% | 11.2% |
| Standard Deviation (Population) | 20.2% | 11.1% |
Demographics Similar to Liberians and Central Americans by Births to Unmarried Women
In terms of births to unmarried women, the demographic groups most similar to Liberians are Spanish American Indian (37.4%, a difference of 0.080%), Immigrants from Central America (37.4%, a difference of 0.14%), Immigrants from Belize (37.3%, a difference of 0.17%), Immigrants from St. Vincent and the Grenadines (37.3%, a difference of 0.18%), and West Indian (37.3%, a difference of 0.30%). Similarly, the demographic groups most similar to Central Americans are Comanche (36.7%, a difference of 0.010%), Immigrants from Senegal (36.7%, a difference of 0.070%), Cherokee (36.7%, a difference of 0.12%), Senegalese (36.8%, a difference of 0.13%), and Subsaharan African (36.7%, a difference of 0.17%).
| Demographics | Rating | Rank | Births to Unmarried Women |
| Sub-Saharan Africans | 0.1 /100 | #264 | Tragic 36.7% |
| Cherokee | 0.1 /100 | #265 | Tragic 36.7% |
| Immigrants | Senegal | 0.1 /100 | #266 | Tragic 36.7% |
| Central Americans | 0.1 /100 | #267 | Tragic 36.7% |
| Comanche | 0.1 /100 | #268 | Tragic 36.7% |
| Senegalese | 0.1 /100 | #269 | Tragic 36.8% |
| Immigrants | Congo | 0.1 /100 | #270 | Tragic 36.8% |
| Immigrants | Barbados | 0.1 /100 | #271 | Tragic 36.8% |
| Choctaw | 0.1 /100 | #272 | Tragic 36.9% |
| Mexicans | 0.1 /100 | #273 | Tragic 36.9% |
| Cree | 0.1 /100 | #274 | Tragic 37.0% |
| Barbadians | 0.1 /100 | #275 | Tragic 37.0% |
| Belizeans | 0.1 /100 | #276 | Tragic 37.0% |
| Guatemalans | 0.1 /100 | #277 | Tragic 37.1% |
| Immigrants | Latin America | 0.1 /100 | #278 | Tragic 37.1% |
| West Indians | 0.1 /100 | #279 | Tragic 37.3% |
| Immigrants | St. Vincent and the Grenadines | 0.1 /100 | #280 | Tragic 37.3% |
| Immigrants | Belize | 0.1 /100 | #281 | Tragic 37.3% |
| Liberians | 0.0 /100 | #282 | Tragic 37.4% |
| Spanish American Indians | 0.0 /100 | #283 | Tragic 37.4% |
| Immigrants | Central America | 0.0 /100 | #284 | Tragic 37.4% |