Guamanian/Chamorro vs Chippewa Births to Unmarried Women
COMPARE
Guamanian/Chamorro
Chippewa
Births to Unmarried Women
Births to Unmarried Women Comparison
Guamanians/Chamorros
Chippewa
31.6%
BIRTHS TO UNMARRIED WOMEN
51.3/ 100
METRIC RATING
170th/ 347
METRIC RANK
42.6%
BIRTHS TO UNMARRIED WOMEN
0.0/ 100
METRIC RATING
330th/ 347
METRIC RANK
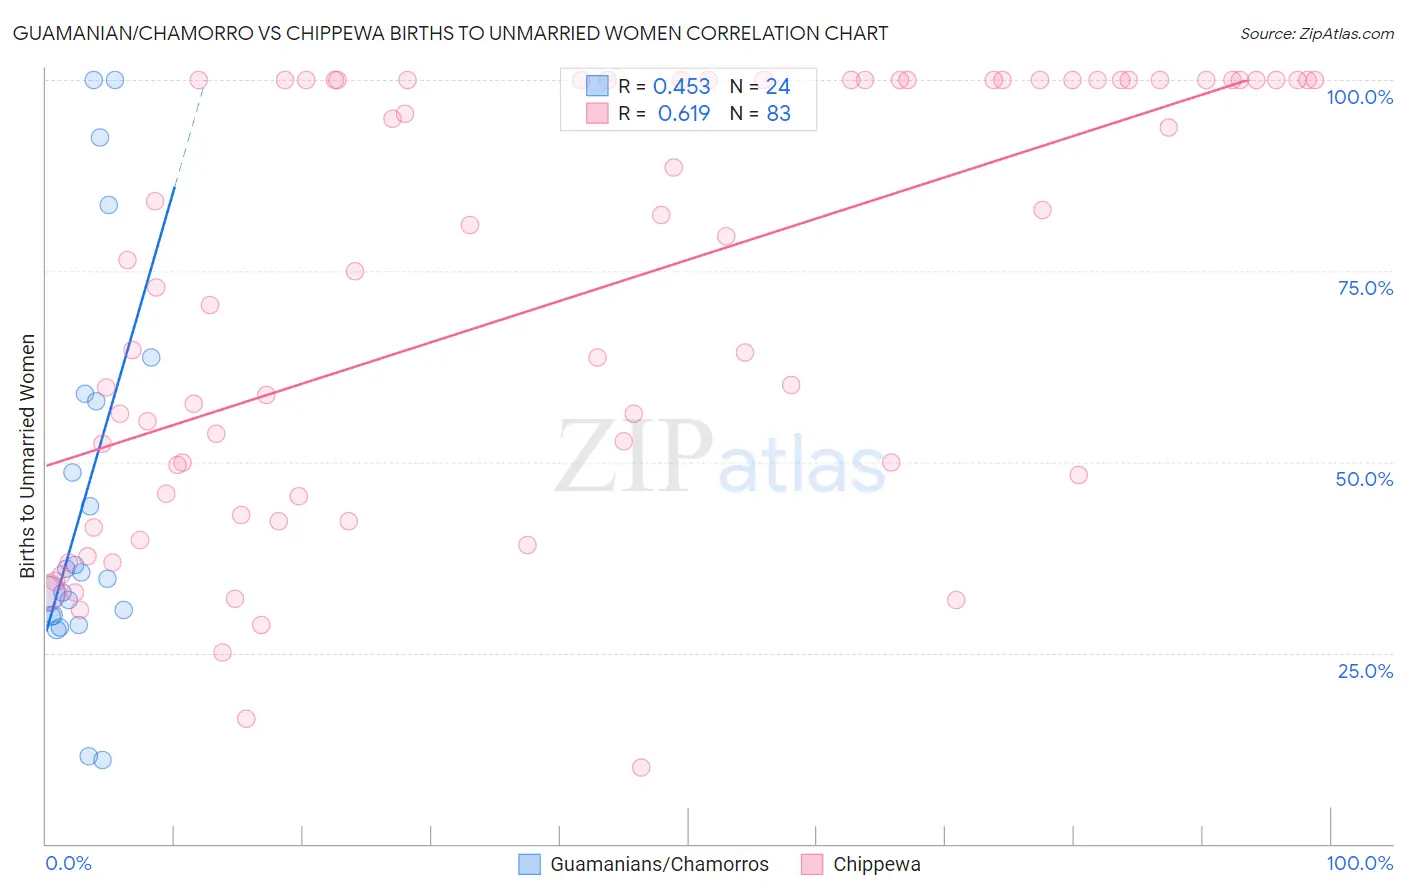
Guamanian/Chamorro vs Chippewa Births to Unmarried Women Correlation Chart
The statistical analysis conducted on geographies consisting of 213,790,025 people shows a moderate positive correlation between the proportion of Guamanians/Chamorros and percentage of births to unmarried women in the United States with a correlation coefficient (R) of 0.453 and weighted average of 31.6%. Similarly, the statistical analysis conducted on geographies consisting of 205,326,129 people shows a significant positive correlation between the proportion of Chippewa and percentage of births to unmarried women in the United States with a correlation coefficient (R) of 0.619 and weighted average of 42.6%, a difference of 34.8%.
Births to Unmarried Women Correlation Summary
| Measurement | Guamanian/Chamorro | Chippewa |
| Minimum | 10.9% | 10.0% |
| Maximum | 100.0% | 100.0% |
| Range | 89.1% | 90.0% |
| Mean | 45.3% | 71.0% |
| Median | 35.1% | 75.0% |
| Interquartile 25% (IQ1) | 29.8% | 45.5% |
| Interquartile 75% (IQ3) | 58.4% | 100.0% |
| Interquartile Range (IQR) | 28.6% | 54.5% |
| Standard Deviation (Sample) | 25.6% | 27.9% |
| Standard Deviation (Population) | 25.1% | 27.7% |
Similar Demographics by Births to Unmarried Women
Demographics Similar to Guamanians/Chamorros by Births to Unmarried Women
In terms of births to unmarried women, the demographic groups most similar to Guamanians/Chamorros are Slavic (31.6%, a difference of 0.070%), Finnish (31.7%, a difference of 0.080%), Immigrants from Eritrea (31.7%, a difference of 0.090%), Belgian (31.6%, a difference of 0.10%), and Immigrants from Yemen (31.7%, a difference of 0.10%).
| Demographics | Rating | Rank | Births to Unmarried Women |
| Immigrants | Chile | 65.7 /100 | #163 | Good 31.2% |
| Hungarians | 64.1 /100 | #164 | Good 31.2% |
| Immigrants | Somalia | 58.1 /100 | #165 | Average 31.4% |
| Peruvians | 55.5 /100 | #166 | Average 31.5% |
| Dutch | 55.3 /100 | #167 | Average 31.5% |
| Belgians | 52.4 /100 | #168 | Average 31.6% |
| Slavs | 52.0 /100 | #169 | Average 31.6% |
| Guamanians/Chamorros | 51.3 /100 | #170 | Average 31.6% |
| Finns | 50.5 /100 | #171 | Average 31.7% |
| Immigrants | Eritrea | 50.4 /100 | #172 | Average 31.7% |
| Immigrants | Yemen | 50.2 /100 | #173 | Average 31.7% |
| Venezuelans | 50.0 /100 | #174 | Average 31.7% |
| Immigrants | Venezuela | 49.2 /100 | #175 | Average 31.7% |
| Scottish | 48.1 /100 | #176 | Average 31.7% |
| South American Indians | 47.7 /100 | #177 | Average 31.7% |
Demographics Similar to Chippewa by Births to Unmarried Women
In terms of births to unmarried women, the demographic groups most similar to Chippewa are Paiute (42.5%, a difference of 0.40%), Native/Alaskan (43.0%, a difference of 0.83%), Immigrants from Cabo Verde (42.2%, a difference of 1.0%), Tsimshian (42.2%, a difference of 1.1%), and Kiowa (43.1%, a difference of 1.2%).
| Demographics | Rating | Rank | Births to Unmarried Women |
| Sioux | 0.0 /100 | #323 | Tragic 41.0% |
| Cape Verdeans | 0.0 /100 | #324 | Tragic 41.3% |
| Cheyenne | 0.0 /100 | #325 | Tragic 41.3% |
| Immigrants | Cuba | 0.0 /100 | #326 | Tragic 41.5% |
| Tsimshian | 0.0 /100 | #327 | Tragic 42.2% |
| Immigrants | Cabo Verde | 0.0 /100 | #328 | Tragic 42.2% |
| Paiute | 0.0 /100 | #329 | Tragic 42.5% |
| Chippewa | 0.0 /100 | #330 | Tragic 42.6% |
| Natives/Alaskans | 0.0 /100 | #331 | Tragic 43.0% |
| Kiowa | 0.0 /100 | #332 | Tragic 43.1% |
| Blacks/African Americans | 0.0 /100 | #333 | Tragic 44.3% |
| Yuman | 0.0 /100 | #334 | Tragic 44.4% |
| Colville | 0.0 /100 | #335 | Tragic 45.3% |
| Puerto Ricans | 0.0 /100 | #336 | Tragic 45.7% |
| Houma | 0.0 /100 | #337 | Tragic 46.6% |