Liberian vs Arab Births to Unmarried Women
COMPARE
Liberian
Arab
Births to Unmarried Women
Births to Unmarried Women Comparison
Liberians
Arabs
37.4%
BIRTHS TO UNMARRIED WOMEN
0.0/ 100
METRIC RATING
282nd/ 347
METRIC RANK
29.2%
BIRTHS TO UNMARRIED WOMEN
96.5/ 100
METRIC RATING
92nd/ 347
METRIC RANK
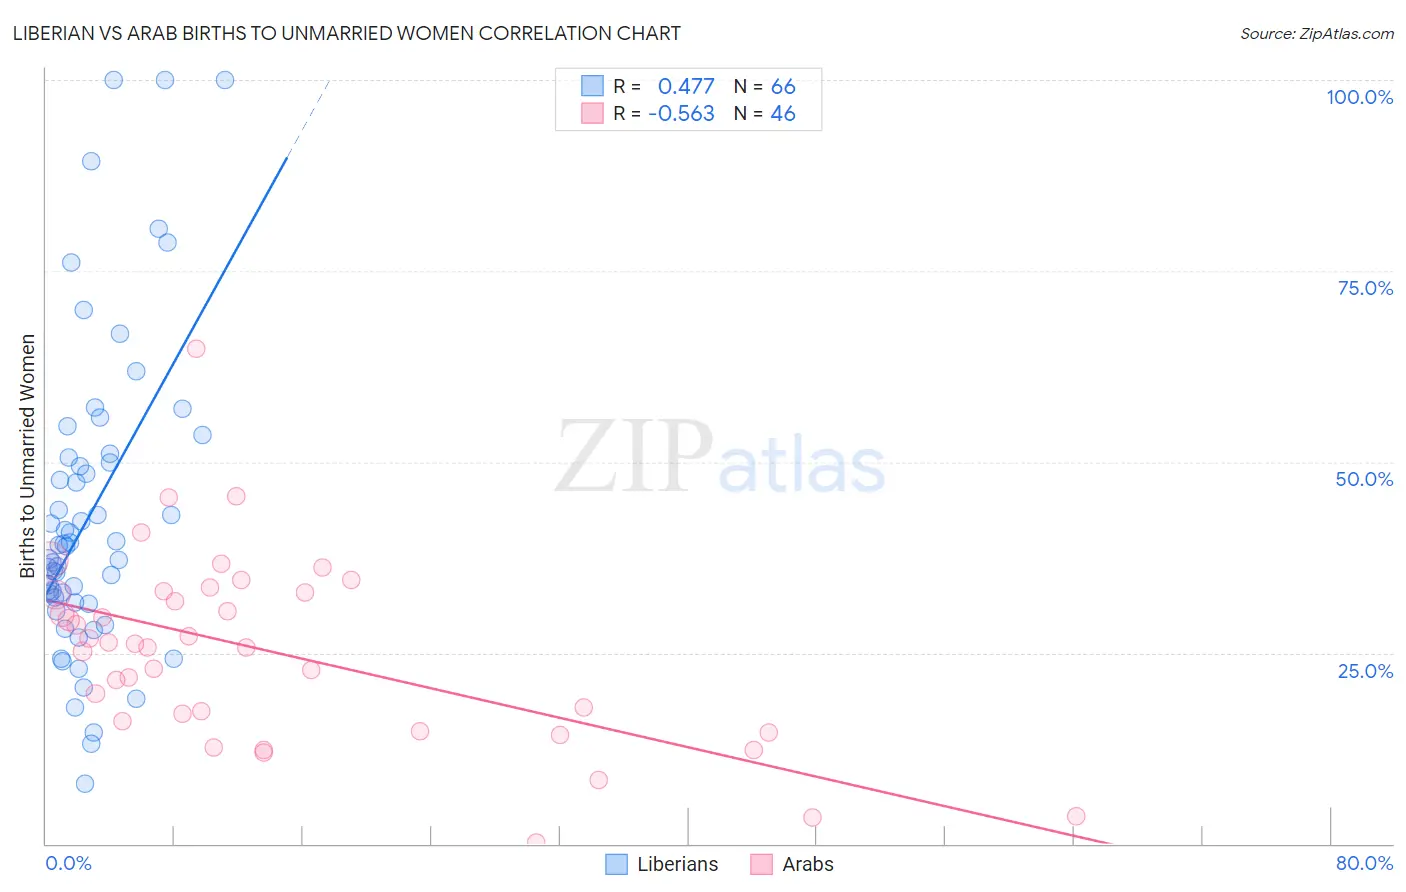
Liberian vs Arab Births to Unmarried Women Correlation Chart
The statistical analysis conducted on geographies consisting of 116,121,082 people shows a moderate positive correlation between the proportion of Liberians and percentage of births to unmarried women in the United States with a correlation coefficient (R) of 0.477 and weighted average of 37.4%. Similarly, the statistical analysis conducted on geographies consisting of 447,045,945 people shows a substantial negative correlation between the proportion of Arabs and percentage of births to unmarried women in the United States with a correlation coefficient (R) of -0.563 and weighted average of 29.2%, a difference of 28.1%.
Births to Unmarried Women Correlation Summary
| Measurement | Liberian | Arab |
| Minimum | 7.8% | 0.20% |
| Maximum | 100.0% | 64.9% |
| Range | 92.2% | 64.7% |
| Mean | 43.2% | 25.1% |
| Median | 39.0% | 26.0% |
| Interquartile 25% (IQ1) | 31.6% | 16.0% |
| Interquartile 75% (IQ3) | 50.5% | 32.9% |
| Interquartile Range (IQR) | 18.9% | 16.9% |
| Standard Deviation (Sample) | 20.4% | 12.3% |
| Standard Deviation (Population) | 20.2% | 12.2% |
Similar Demographics by Births to Unmarried Women
Demographics Similar to Liberians by Births to Unmarried Women
In terms of births to unmarried women, the demographic groups most similar to Liberians are Spanish American Indian (37.4%, a difference of 0.080%), Immigrants from Central America (37.4%, a difference of 0.14%), Immigrants from Belize (37.3%, a difference of 0.17%), Immigrants from St. Vincent and the Grenadines (37.3%, a difference of 0.18%), and Immigrants from Mexico (37.5%, a difference of 0.24%).
| Demographics | Rating | Rank | Births to Unmarried Women |
| Barbadians | 0.1 /100 | #275 | Tragic 37.0% |
| Belizeans | 0.1 /100 | #276 | Tragic 37.0% |
| Guatemalans | 0.1 /100 | #277 | Tragic 37.1% |
| Immigrants | Latin America | 0.1 /100 | #278 | Tragic 37.1% |
| West Indians | 0.1 /100 | #279 | Tragic 37.3% |
| Immigrants | St. Vincent and the Grenadines | 0.1 /100 | #280 | Tragic 37.3% |
| Immigrants | Belize | 0.1 /100 | #281 | Tragic 37.3% |
| Liberians | 0.0 /100 | #282 | Tragic 37.4% |
| Spanish American Indians | 0.0 /100 | #283 | Tragic 37.4% |
| Immigrants | Central America | 0.0 /100 | #284 | Tragic 37.4% |
| Immigrants | Mexico | 0.0 /100 | #285 | Tragic 37.5% |
| Immigrants | Guatemala | 0.0 /100 | #286 | Tragic 37.5% |
| Creek | 0.0 /100 | #287 | Tragic 37.6% |
| Immigrants | Liberia | 0.0 /100 | #288 | Tragic 37.6% |
| Alaskan Athabascans | 0.0 /100 | #289 | Tragic 37.7% |
Demographics Similar to Arabs by Births to Unmarried Women
In terms of births to unmarried women, the demographic groups most similar to Arabs are Immigrants from Fiji (29.2%, a difference of 0.040%), Estonian (29.2%, a difference of 0.040%), Ukrainian (29.2%, a difference of 0.16%), Immigrants from Latvia (29.1%, a difference of 0.25%), and Immigrants from Vietnam (29.3%, a difference of 0.30%).
| Demographics | Rating | Rank | Births to Unmarried Women |
| Sri Lankans | 97.5 /100 | #85 | Exceptional 28.9% |
| Immigrants | Jordan | 97.4 /100 | #86 | Exceptional 29.0% |
| Taiwanese | 97.3 /100 | #87 | Exceptional 29.0% |
| Immigrants | France | 97.3 /100 | #88 | Exceptional 29.0% |
| Immigrants | Saudi Arabia | 97.0 /100 | #89 | Exceptional 29.1% |
| Immigrants | Latvia | 96.8 /100 | #90 | Exceptional 29.1% |
| Immigrants | Fiji | 96.6 /100 | #91 | Exceptional 29.2% |
| Arabs | 96.5 /100 | #92 | Exceptional 29.2% |
| Estonians | 96.5 /100 | #93 | Exceptional 29.2% |
| Ukrainians | 96.3 /100 | #94 | Exceptional 29.2% |
| Immigrants | Vietnam | 96.1 /100 | #95 | Exceptional 29.3% |
| Norwegians | 95.8 /100 | #96 | Exceptional 29.3% |
| Immigrants | South Africa | 95.7 /100 | #97 | Exceptional 29.3% |
| Immigrants | Syria | 95.7 /100 | #98 | Exceptional 29.4% |
| Immigrants | Denmark | 95.3 /100 | #99 | Exceptional 29.4% |