Liberian vs Chippewa Male Disability
COMPARE
Liberian
Chippewa
Male Disability
Male Disability Comparison
Liberians
Chippewa
11.8%
MALE DISABILITY
3.1/ 100
METRIC RATING
225th/ 347
METRIC RANK
14.3%
MALE DISABILITY
0.0/ 100
METRIC RATING
328th/ 347
METRIC RANK
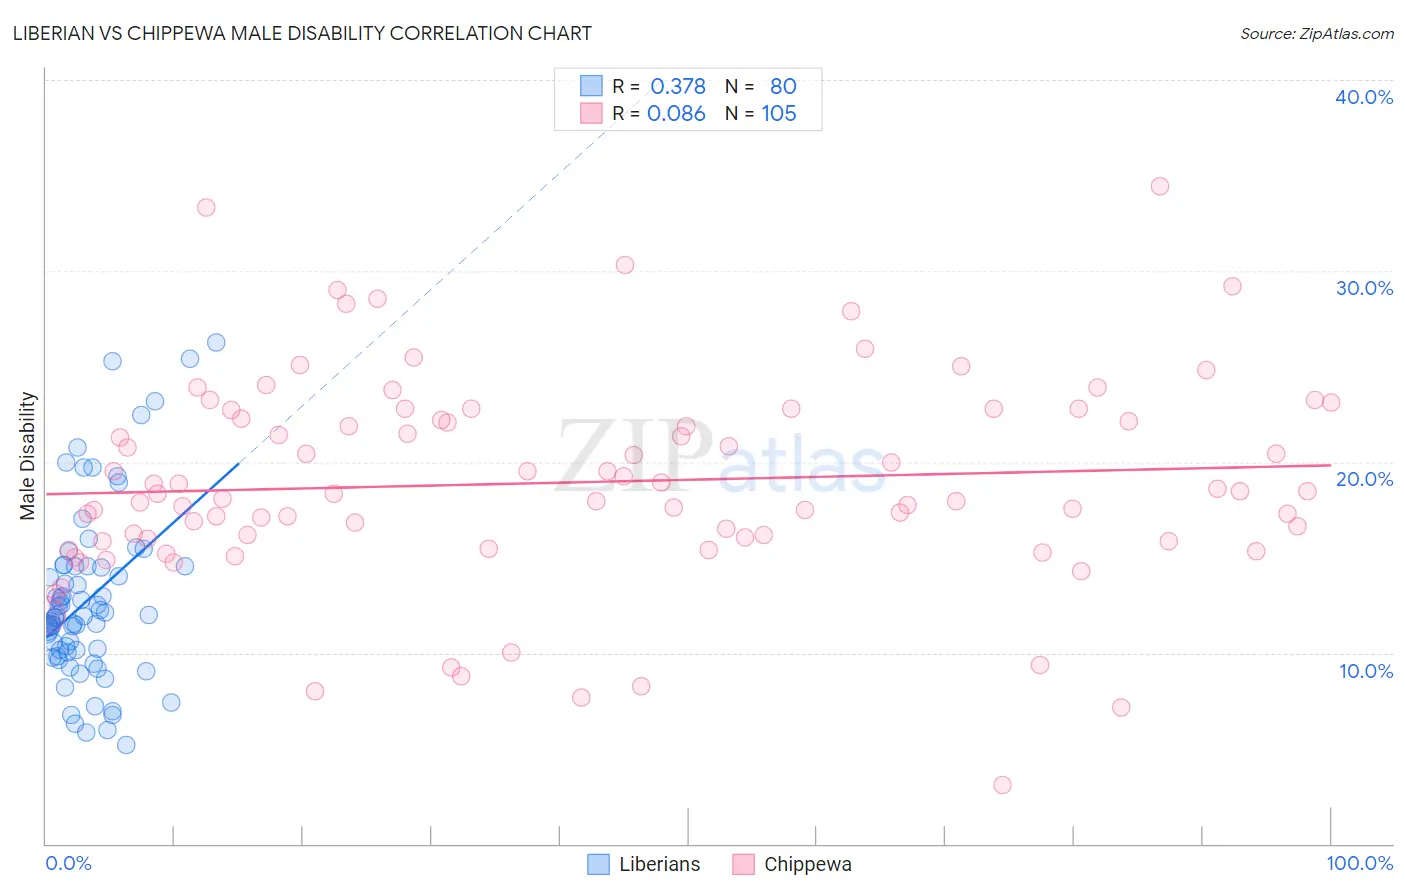
Liberian vs Chippewa Male Disability Correlation Chart
The statistical analysis conducted on geographies consisting of 118,082,647 people shows a mild positive correlation between the proportion of Liberians and percentage of males with a disability in the United States with a correlation coefficient (R) of 0.378 and weighted average of 11.8%. Similarly, the statistical analysis conducted on geographies consisting of 215,038,110 people shows a slight positive correlation between the proportion of Chippewa and percentage of males with a disability in the United States with a correlation coefficient (R) of 0.086 and weighted average of 14.3%, a difference of 21.5%.
Male Disability Correlation Summary
| Measurement | Liberian | Chippewa |
| Minimum | 5.2% | 3.1% |
| Maximum | 26.3% | 34.5% |
| Range | 21.1% | 31.4% |
| Mean | 12.8% | 18.9% |
| Median | 11.9% | 18.3% |
| Interquartile 25% (IQ1) | 10.1% | 15.9% |
| Interquartile 75% (IQ3) | 14.5% | 22.5% |
| Interquartile Range (IQR) | 4.5% | 6.6% |
| Standard Deviation (Sample) | 4.5% | 5.5% |
| Standard Deviation (Population) | 4.5% | 5.4% |
Similar Demographics by Male Disability
Demographics Similar to Liberians by Male Disability
In terms of male disability, the demographic groups most similar to Liberians are Japanese (11.7%, a difference of 0.010%), Immigrants from Bahamas (11.7%, a difference of 0.030%), Alsatian (11.7%, a difference of 0.12%), Subsaharan African (11.8%, a difference of 0.12%), and Immigrants from Congo (11.7%, a difference of 0.27%).
| Demographics | Rating | Rank | Male Disability |
| Immigrants | England | 4.0 /100 | #218 | Tragic 11.7% |
| Panamanians | 3.8 /100 | #219 | Tragic 11.7% |
| Immigrants | Western Europe | 3.8 /100 | #220 | Tragic 11.7% |
| Immigrants | Congo | 3.7 /100 | #221 | Tragic 11.7% |
| Alsatians | 3.3 /100 | #222 | Tragic 11.7% |
| Immigrants | Bahamas | 3.2 /100 | #223 | Tragic 11.7% |
| Japanese | 3.1 /100 | #224 | Tragic 11.7% |
| Liberians | 3.1 /100 | #225 | Tragic 11.8% |
| Sub-Saharan Africans | 2.8 /100 | #226 | Tragic 11.8% |
| Austrians | 2.5 /100 | #227 | Tragic 11.8% |
| Hispanics or Latinos | 2.3 /100 | #228 | Tragic 11.8% |
| Bermudans | 2.3 /100 | #229 | Tragic 11.8% |
| Croatians | 2.1 /100 | #230 | Tragic 11.8% |
| Dominicans | 1.8 /100 | #231 | Tragic 11.8% |
| Malaysians | 1.8 /100 | #232 | Tragic 11.8% |
Demographics Similar to Chippewa by Male Disability
In terms of male disability, the demographic groups most similar to Chippewa are Potawatomi (14.2%, a difference of 0.43%), Native/Alaskan (14.2%, a difference of 0.53%), Cajun (14.4%, a difference of 0.57%), Navajo (14.4%, a difference of 0.81%), and Ottawa (14.1%, a difference of 1.5%).
| Demographics | Rating | Rank | Male Disability |
| Shoshone | 0.0 /100 | #321 | Tragic 13.8% |
| Apache | 0.0 /100 | #322 | Tragic 14.0% |
| Osage | 0.0 /100 | #323 | Tragic 14.0% |
| Comanche | 0.0 /100 | #324 | Tragic 14.1% |
| Ottawa | 0.0 /100 | #325 | Tragic 14.1% |
| Natives/Alaskans | 0.0 /100 | #326 | Tragic 14.2% |
| Potawatomi | 0.0 /100 | #327 | Tragic 14.2% |
| Chippewa | 0.0 /100 | #328 | Tragic 14.3% |
| Cajuns | 0.0 /100 | #329 | Tragic 14.4% |
| Navajo | 0.0 /100 | #330 | Tragic 14.4% |
| Tohono O'odham | 0.0 /100 | #331 | Tragic 14.6% |
| Seminole | 0.0 /100 | #332 | Tragic 14.7% |
| Yuman | 0.0 /100 | #333 | Tragic 14.7% |
| Cherokee | 0.0 /100 | #334 | Tragic 14.8% |
| Dutch West Indians | 0.0 /100 | #335 | Tragic 14.8% |