Liberian vs Cree Births to Unmarried Women
COMPARE
Liberian
Cree
Births to Unmarried Women
Births to Unmarried Women Comparison
Liberians
Cree
37.4%
BIRTHS TO UNMARRIED WOMEN
0.0/ 100
METRIC RATING
282nd/ 347
METRIC RANK
37.0%
BIRTHS TO UNMARRIED WOMEN
0.1/ 100
METRIC RATING
274th/ 347
METRIC RANK
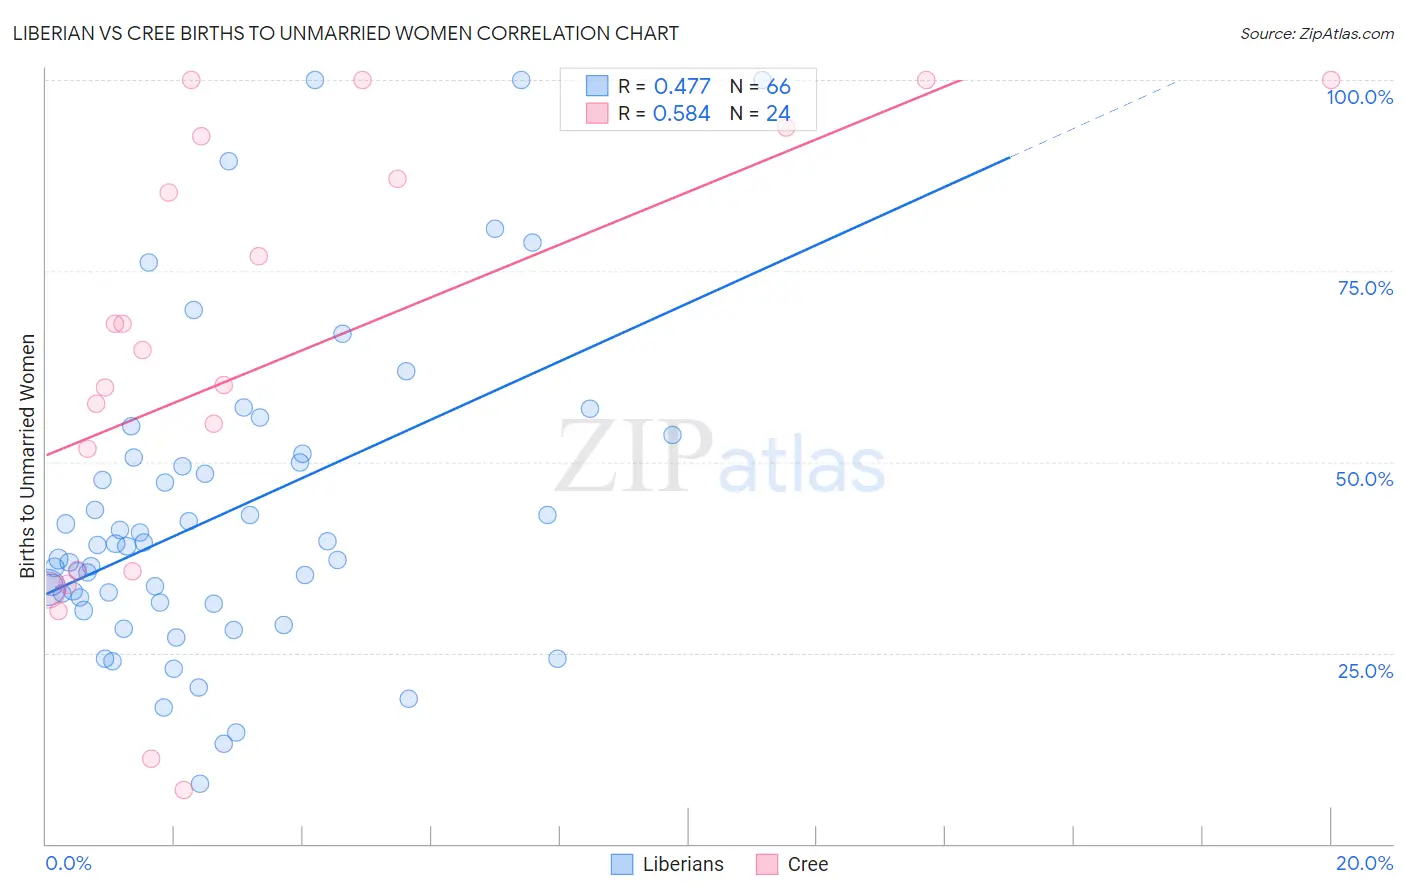
Liberian vs Cree Births to Unmarried Women Correlation Chart
The statistical analysis conducted on geographies consisting of 116,121,082 people shows a moderate positive correlation between the proportion of Liberians and percentage of births to unmarried women in the United States with a correlation coefficient (R) of 0.477 and weighted average of 37.4%. Similarly, the statistical analysis conducted on geographies consisting of 74,807,025 people shows a substantial positive correlation between the proportion of Cree and percentage of births to unmarried women in the United States with a correlation coefficient (R) of 0.584 and weighted average of 37.0%, a difference of 1.2%.
Births to Unmarried Women Correlation Summary
| Measurement | Liberian | Cree |
| Minimum | 7.8% | 7.1% |
| Maximum | 100.0% | 100.0% |
| Range | 92.2% | 92.9% |
| Mean | 43.2% | 62.8% |
| Median | 39.0% | 62.3% |
| Interquartile 25% (IQ1) | 31.6% | 35.7% |
| Interquartile 75% (IQ3) | 50.5% | 89.8% |
| Interquartile Range (IQR) | 18.9% | 54.1% |
| Standard Deviation (Sample) | 20.4% | 28.7% |
| Standard Deviation (Population) | 20.2% | 28.1% |
Demographics Similar to Liberians and Cree by Births to Unmarried Women
In terms of births to unmarried women, the demographic groups most similar to Liberians are Spanish American Indian (37.4%, a difference of 0.080%), Immigrants from Central America (37.4%, a difference of 0.14%), Immigrants from Belize (37.3%, a difference of 0.17%), Immigrants from St. Vincent and the Grenadines (37.3%, a difference of 0.18%), and Immigrants from Mexico (37.5%, a difference of 0.24%). Similarly, the demographic groups most similar to Cree are Barbadian (37.0%, a difference of 0.030%), Mexican (36.9%, a difference of 0.090%), Choctaw (36.9%, a difference of 0.21%), Belizean (37.0%, a difference of 0.22%), and Immigrants from Barbados (36.8%, a difference of 0.43%).
| Demographics | Rating | Rank | Births to Unmarried Women |
| Comanche | 0.1 /100 | #268 | Tragic 36.7% |
| Senegalese | 0.1 /100 | #269 | Tragic 36.8% |
| Immigrants | Congo | 0.1 /100 | #270 | Tragic 36.8% |
| Immigrants | Barbados | 0.1 /100 | #271 | Tragic 36.8% |
| Choctaw | 0.1 /100 | #272 | Tragic 36.9% |
| Mexicans | 0.1 /100 | #273 | Tragic 36.9% |
| Cree | 0.1 /100 | #274 | Tragic 37.0% |
| Barbadians | 0.1 /100 | #275 | Tragic 37.0% |
| Belizeans | 0.1 /100 | #276 | Tragic 37.0% |
| Guatemalans | 0.1 /100 | #277 | Tragic 37.1% |
| Immigrants | Latin America | 0.1 /100 | #278 | Tragic 37.1% |
| West Indians | 0.1 /100 | #279 | Tragic 37.3% |
| Immigrants | St. Vincent and the Grenadines | 0.1 /100 | #280 | Tragic 37.3% |
| Immigrants | Belize | 0.1 /100 | #281 | Tragic 37.3% |
| Liberians | 0.0 /100 | #282 | Tragic 37.4% |
| Spanish American Indians | 0.0 /100 | #283 | Tragic 37.4% |
| Immigrants | Central America | 0.0 /100 | #284 | Tragic 37.4% |
| Immigrants | Mexico | 0.0 /100 | #285 | Tragic 37.5% |
| Immigrants | Guatemala | 0.0 /100 | #286 | Tragic 37.5% |
| Creek | 0.0 /100 | #287 | Tragic 37.6% |
| Immigrants | Liberia | 0.0 /100 | #288 | Tragic 37.6% |