Swiss vs Chippewa Births to Unmarried Women
COMPARE
Swiss
Chippewa
Births to Unmarried Women
Births to Unmarried Women Comparison
Swiss
Chippewa
30.5%
BIRTHS TO UNMARRIED WOMEN
83.1/ 100
METRIC RATING
140th/ 347
METRIC RANK
42.6%
BIRTHS TO UNMARRIED WOMEN
0.0/ 100
METRIC RATING
330th/ 347
METRIC RANK
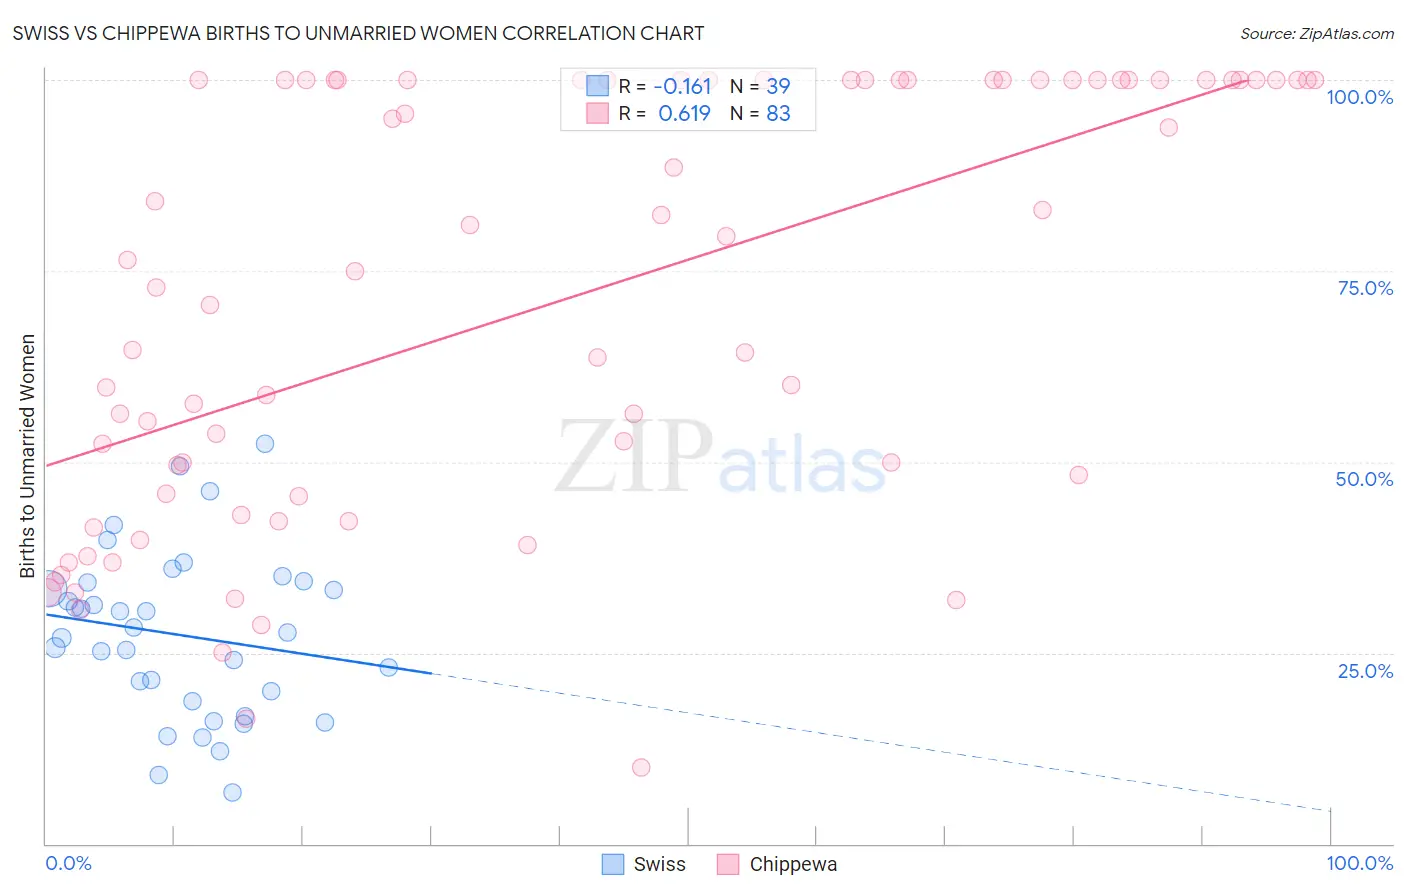
Swiss vs Chippewa Births to Unmarried Women Correlation Chart
The statistical analysis conducted on geographies consisting of 422,325,964 people shows a poor negative correlation between the proportion of Swiss and percentage of births to unmarried women in the United States with a correlation coefficient (R) of -0.161 and weighted average of 30.5%. Similarly, the statistical analysis conducted on geographies consisting of 205,326,129 people shows a significant positive correlation between the proportion of Chippewa and percentage of births to unmarried women in the United States with a correlation coefficient (R) of 0.619 and weighted average of 42.6%, a difference of 39.9%.
Births to Unmarried Women Correlation Summary
| Measurement | Swiss | Chippewa |
| Minimum | 6.7% | 10.0% |
| Maximum | 52.4% | 100.0% |
| Range | 45.7% | 90.0% |
| Mean | 27.3% | 71.0% |
| Median | 27.7% | 75.0% |
| Interquartile 25% (IQ1) | 18.6% | 45.5% |
| Interquartile 75% (IQ3) | 34.3% | 100.0% |
| Interquartile Range (IQR) | 15.6% | 54.5% |
| Standard Deviation (Sample) | 10.8% | 27.9% |
| Standard Deviation (Population) | 10.6% | 27.7% |
Similar Demographics by Births to Unmarried Women
Demographics Similar to Swiss by Births to Unmarried Women
In terms of births to unmarried women, the demographic groups most similar to Swiss are Pakistani (30.5%, a difference of 0.020%), South African (30.5%, a difference of 0.080%), Immigrants from Uganda (30.5%, a difference of 0.10%), Immigrants from Canada (30.4%, a difference of 0.11%), and Immigrants from Philippines (30.4%, a difference of 0.14%).
| Demographics | Rating | Rank | Births to Unmarried Women |
| Immigrants | Morocco | 85.2 /100 | #133 | Excellent 30.4% |
| Immigrants | South Eastern Asia | 85.2 /100 | #134 | Excellent 30.4% |
| Brazilians | 84.8 /100 | #135 | Excellent 30.4% |
| Immigrants | Scotland | 84.6 /100 | #136 | Excellent 30.4% |
| Immigrants | Philippines | 83.9 /100 | #137 | Excellent 30.4% |
| Puget Sound Salish | 83.9 /100 | #138 | Excellent 30.4% |
| Immigrants | Canada | 83.7 /100 | #139 | Excellent 30.4% |
| Swiss | 83.1 /100 | #140 | Excellent 30.5% |
| Pakistanis | 83.0 /100 | #141 | Excellent 30.5% |
| South Africans | 82.7 /100 | #142 | Excellent 30.5% |
| Immigrants | Uganda | 82.6 /100 | #143 | Excellent 30.5% |
| Czechs | 82.1 /100 | #144 | Excellent 30.5% |
| Immigrants | North America | 81.5 /100 | #145 | Excellent 30.6% |
| Northern Europeans | 81.4 /100 | #146 | Excellent 30.6% |
| Immigrants | Oceania | 81.2 /100 | #147 | Excellent 30.6% |
Demographics Similar to Chippewa by Births to Unmarried Women
In terms of births to unmarried women, the demographic groups most similar to Chippewa are Paiute (42.5%, a difference of 0.40%), Native/Alaskan (43.0%, a difference of 0.83%), Immigrants from Cabo Verde (42.2%, a difference of 1.0%), Tsimshian (42.2%, a difference of 1.1%), and Kiowa (43.1%, a difference of 1.2%).
| Demographics | Rating | Rank | Births to Unmarried Women |
| Sioux | 0.0 /100 | #323 | Tragic 41.0% |
| Cape Verdeans | 0.0 /100 | #324 | Tragic 41.3% |
| Cheyenne | 0.0 /100 | #325 | Tragic 41.3% |
| Immigrants | Cuba | 0.0 /100 | #326 | Tragic 41.5% |
| Tsimshian | 0.0 /100 | #327 | Tragic 42.2% |
| Immigrants | Cabo Verde | 0.0 /100 | #328 | Tragic 42.2% |
| Paiute | 0.0 /100 | #329 | Tragic 42.5% |
| Chippewa | 0.0 /100 | #330 | Tragic 42.6% |
| Natives/Alaskans | 0.0 /100 | #331 | Tragic 43.0% |
| Kiowa | 0.0 /100 | #332 | Tragic 43.1% |
| Blacks/African Americans | 0.0 /100 | #333 | Tragic 44.3% |
| Yuman | 0.0 /100 | #334 | Tragic 44.4% |
| Colville | 0.0 /100 | #335 | Tragic 45.3% |
| Puerto Ricans | 0.0 /100 | #336 | Tragic 45.7% |
| Houma | 0.0 /100 | #337 | Tragic 46.6% |