Liberian vs Immigrants from Kazakhstan Births to Unmarried Women
COMPARE
Liberian
Immigrants from Kazakhstan
Births to Unmarried Women
Births to Unmarried Women Comparison
Liberians
Immigrants from Kazakhstan
37.4%
BIRTHS TO UNMARRIED WOMEN
0.0/ 100
METRIC RATING
282nd/ 347
METRIC RANK
28.1%
BIRTHS TO UNMARRIED WOMEN
99.1/ 100
METRIC RATING
59th/ 347
METRIC RANK
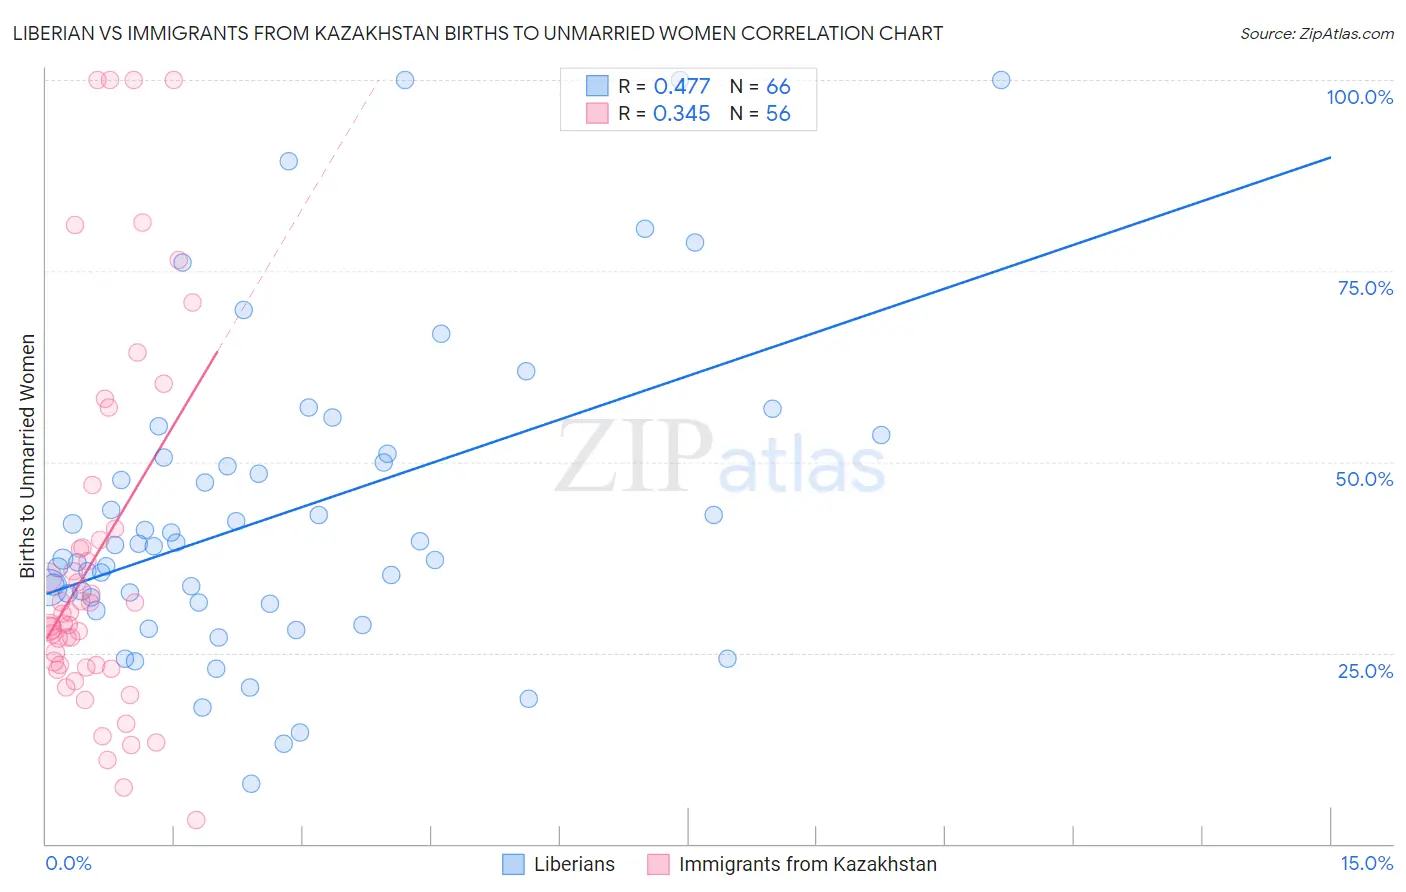
Liberian vs Immigrants from Kazakhstan Births to Unmarried Women Correlation Chart
The statistical analysis conducted on geographies consisting of 116,121,082 people shows a moderate positive correlation between the proportion of Liberians and percentage of births to unmarried women in the United States with a correlation coefficient (R) of 0.477 and weighted average of 37.4%. Similarly, the statistical analysis conducted on geographies consisting of 120,028,218 people shows a mild positive correlation between the proportion of Immigrants from Kazakhstan and percentage of births to unmarried women in the United States with a correlation coefficient (R) of 0.345 and weighted average of 28.1%, a difference of 33.0%.
Births to Unmarried Women Correlation Summary
| Measurement | Liberian | Immigrants from Kazakhstan |
| Minimum | 7.8% | 3.1% |
| Maximum | 100.0% | 100.0% |
| Range | 92.2% | 96.9% |
| Mean | 43.2% | 37.8% |
| Median | 39.0% | 29.4% |
| Interquartile 25% (IQ1) | 31.6% | 23.2% |
| Interquartile 75% (IQ3) | 50.5% | 40.5% |
| Interquartile Range (IQR) | 18.9% | 17.2% |
| Standard Deviation (Sample) | 20.4% | 24.5% |
| Standard Deviation (Population) | 20.2% | 24.3% |
Similar Demographics by Births to Unmarried Women
Demographics Similar to Liberians by Births to Unmarried Women
In terms of births to unmarried women, the demographic groups most similar to Liberians are Spanish American Indian (37.4%, a difference of 0.080%), Immigrants from Central America (37.4%, a difference of 0.14%), Immigrants from Belize (37.3%, a difference of 0.17%), Immigrants from St. Vincent and the Grenadines (37.3%, a difference of 0.18%), and Immigrants from Mexico (37.5%, a difference of 0.24%).
| Demographics | Rating | Rank | Births to Unmarried Women |
| Barbadians | 0.1 /100 | #275 | Tragic 37.0% |
| Belizeans | 0.1 /100 | #276 | Tragic 37.0% |
| Guatemalans | 0.1 /100 | #277 | Tragic 37.1% |
| Immigrants | Latin America | 0.1 /100 | #278 | Tragic 37.1% |
| West Indians | 0.1 /100 | #279 | Tragic 37.3% |
| Immigrants | St. Vincent and the Grenadines | 0.1 /100 | #280 | Tragic 37.3% |
| Immigrants | Belize | 0.1 /100 | #281 | Tragic 37.3% |
| Liberians | 0.0 /100 | #282 | Tragic 37.4% |
| Spanish American Indians | 0.0 /100 | #283 | Tragic 37.4% |
| Immigrants | Central America | 0.0 /100 | #284 | Tragic 37.4% |
| Immigrants | Mexico | 0.0 /100 | #285 | Tragic 37.5% |
| Immigrants | Guatemala | 0.0 /100 | #286 | Tragic 37.5% |
| Creek | 0.0 /100 | #287 | Tragic 37.6% |
| Immigrants | Liberia | 0.0 /100 | #288 | Tragic 37.6% |
| Alaskan Athabascans | 0.0 /100 | #289 | Tragic 37.7% |
Demographics Similar to Immigrants from Kazakhstan by Births to Unmarried Women
In terms of births to unmarried women, the demographic groups most similar to Immigrants from Kazakhstan are Immigrants from Turkey (28.1%, a difference of 0.040%), Immigrants from North Macedonia (28.1%, a difference of 0.090%), Immigrants from Albania (28.0%, a difference of 0.25%), Russian (28.0%, a difference of 0.36%), and Egyptian (28.2%, a difference of 0.41%).
| Demographics | Rating | Rank | Births to Unmarried Women |
| Bhutanese | 99.4 /100 | #52 | Exceptional 27.9% |
| Immigrants | Romania | 99.4 /100 | #53 | Exceptional 27.9% |
| Afghans | 99.4 /100 | #54 | Exceptional 27.9% |
| Mongolians | 99.3 /100 | #55 | Exceptional 27.9% |
| Immigrants | Belgium | 99.3 /100 | #56 | Exceptional 28.0% |
| Russians | 99.2 /100 | #57 | Exceptional 28.0% |
| Immigrants | Albania | 99.2 /100 | #58 | Exceptional 28.0% |
| Immigrants | Kazakhstan | 99.1 /100 | #59 | Exceptional 28.1% |
| Immigrants | Turkey | 99.1 /100 | #60 | Exceptional 28.1% |
| Immigrants | North Macedonia | 99.1 /100 | #61 | Exceptional 28.1% |
| Egyptians | 99.0 /100 | #62 | Exceptional 28.2% |
| Immigrants | Serbia | 98.9 /100 | #63 | Exceptional 28.3% |
| Tongans | 98.8 /100 | #64 | Exceptional 28.4% |
| Immigrants | Czechoslovakia | 98.8 /100 | #65 | Exceptional 28.4% |
| Immigrants | Egypt | 98.8 /100 | #66 | Exceptional 28.4% |