Korean vs Immigrants from Nepal Births to Unmarried Women
COMPARE
Korean
Immigrants from Nepal
Births to Unmarried Women
Births to Unmarried Women Comparison
Koreans
Immigrants from Nepal
30.1%
BIRTHS TO UNMARRIED WOMEN
88.9/ 100
METRIC RATING
121st/ 347
METRIC RANK
29.6%
BIRTHS TO UNMARRIED WOMEN
94.3/ 100
METRIC RATING
105th/ 347
METRIC RANK
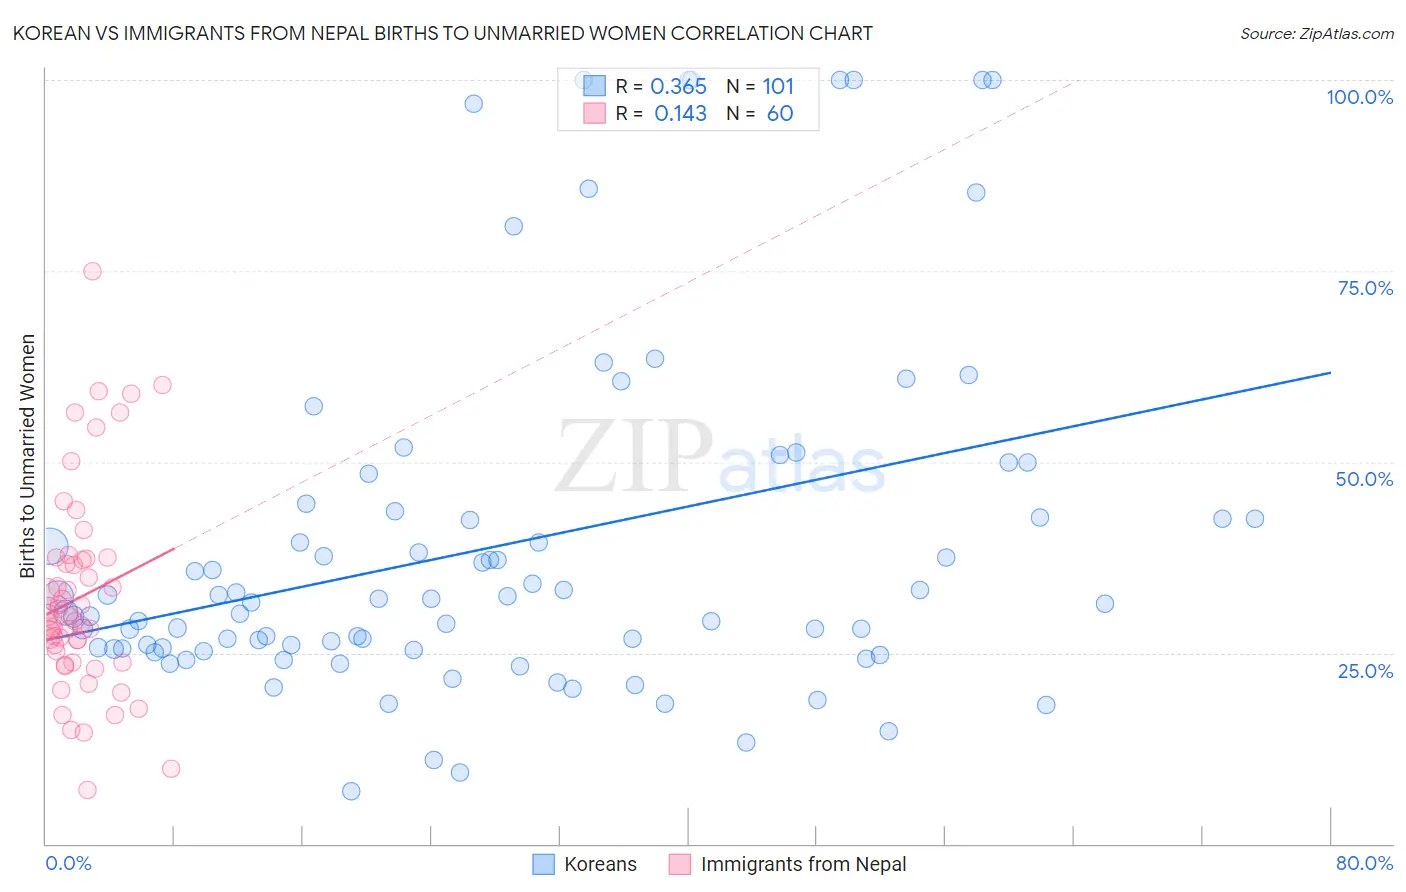
Korean vs Immigrants from Nepal Births to Unmarried Women Correlation Chart
The statistical analysis conducted on geographies consisting of 466,988,654 people shows a mild positive correlation between the proportion of Koreans and percentage of births to unmarried women in the United States with a correlation coefficient (R) of 0.365 and weighted average of 30.1%. Similarly, the statistical analysis conducted on geographies consisting of 179,543,863 people shows a poor positive correlation between the proportion of Immigrants from Nepal and percentage of births to unmarried women in the United States with a correlation coefficient (R) of 0.143 and weighted average of 29.6%, a difference of 1.8%.
Births to Unmarried Women Correlation Summary
| Measurement | Korean | Immigrants from Nepal |
| Minimum | 6.8% | 7.1% |
| Maximum | 100.0% | 75.0% |
| Range | 93.2% | 67.9% |
| Mean | 39.1% | 32.2% |
| Median | 31.5% | 29.6% |
| Interquartile 25% (IQ1) | 25.5% | 24.5% |
| Interquartile 75% (IQ3) | 43.1% | 37.3% |
| Interquartile Range (IQR) | 17.6% | 12.8% |
| Standard Deviation (Sample) | 22.9% | 13.2% |
| Standard Deviation (Population) | 22.8% | 13.0% |
Demographics Similar to Koreans and Immigrants from Nepal by Births to Unmarried Women
In terms of births to unmarried women, the demographic groups most similar to Koreans are Immigrants from Argentina (30.1%, a difference of 0.050%), Ugandan (30.1%, a difference of 0.070%), Syrian (30.2%, a difference of 0.18%), Argentinean (30.0%, a difference of 0.44%), and Immigrants from Norway (29.9%, a difference of 0.58%). Similarly, the demographic groups most similar to Immigrants from Nepal are Lithuanian (29.6%, a difference of 0.050%), Lebanese (29.5%, a difference of 0.060%), Swedish (29.6%, a difference of 0.25%), Immigrants from Brazil (29.6%, a difference of 0.27%), and Paraguayan (29.7%, a difference of 0.35%).
| Demographics | Rating | Rank | Births to Unmarried Women |
| Lebanese | 94.4 /100 | #103 | Exceptional 29.5% |
| Lithuanians | 94.4 /100 | #104 | Exceptional 29.6% |
| Immigrants | Nepal | 94.3 /100 | #105 | Exceptional 29.6% |
| Swedes | 93.8 /100 | #106 | Exceptional 29.6% |
| Immigrants | Brazil | 93.7 /100 | #107 | Exceptional 29.6% |
| Paraguayans | 93.5 /100 | #108 | Exceptional 29.7% |
| Greeks | 93.4 /100 | #109 | Exceptional 29.7% |
| Immigrants | Ethiopia | 93.4 /100 | #110 | Exceptional 29.7% |
| Immigrants | Hungary | 93.0 /100 | #111 | Exceptional 29.7% |
| Basques | 93.0 /100 | #112 | Exceptional 29.7% |
| Scandinavians | 92.7 /100 | #113 | Exceptional 29.8% |
| Immigrants | Croatia | 92.6 /100 | #114 | Exceptional 29.8% |
| Ethiopians | 91.9 /100 | #115 | Exceptional 29.8% |
| Immigrants | Italy | 91.7 /100 | #116 | Exceptional 29.9% |
| Immigrants | Netherlands | 91.1 /100 | #117 | Exceptional 29.9% |
| Immigrants | Norway | 91.0 /100 | #118 | Exceptional 29.9% |
| Argentineans | 90.5 /100 | #119 | Exceptional 30.0% |
| Ugandans | 89.2 /100 | #120 | Excellent 30.1% |
| Koreans | 88.9 /100 | #121 | Excellent 30.1% |
| Immigrants | Argentina | 88.7 /100 | #122 | Excellent 30.1% |
| Syrians | 88.2 /100 | #123 | Excellent 30.2% |