Korean vs Immigrants from Zaire Currently Married
COMPARE
Korean
Immigrants from Zaire
Currently Married
Currently Married Comparison
Koreans
Immigrants from Zaire
47.9%
CURRENTLY MARRIED
95.4/ 100
METRIC RATING
92nd/ 347
METRIC RANK
42.0%
CURRENTLY MARRIED
0.0/ 100
METRIC RATING
302nd/ 347
METRIC RANK
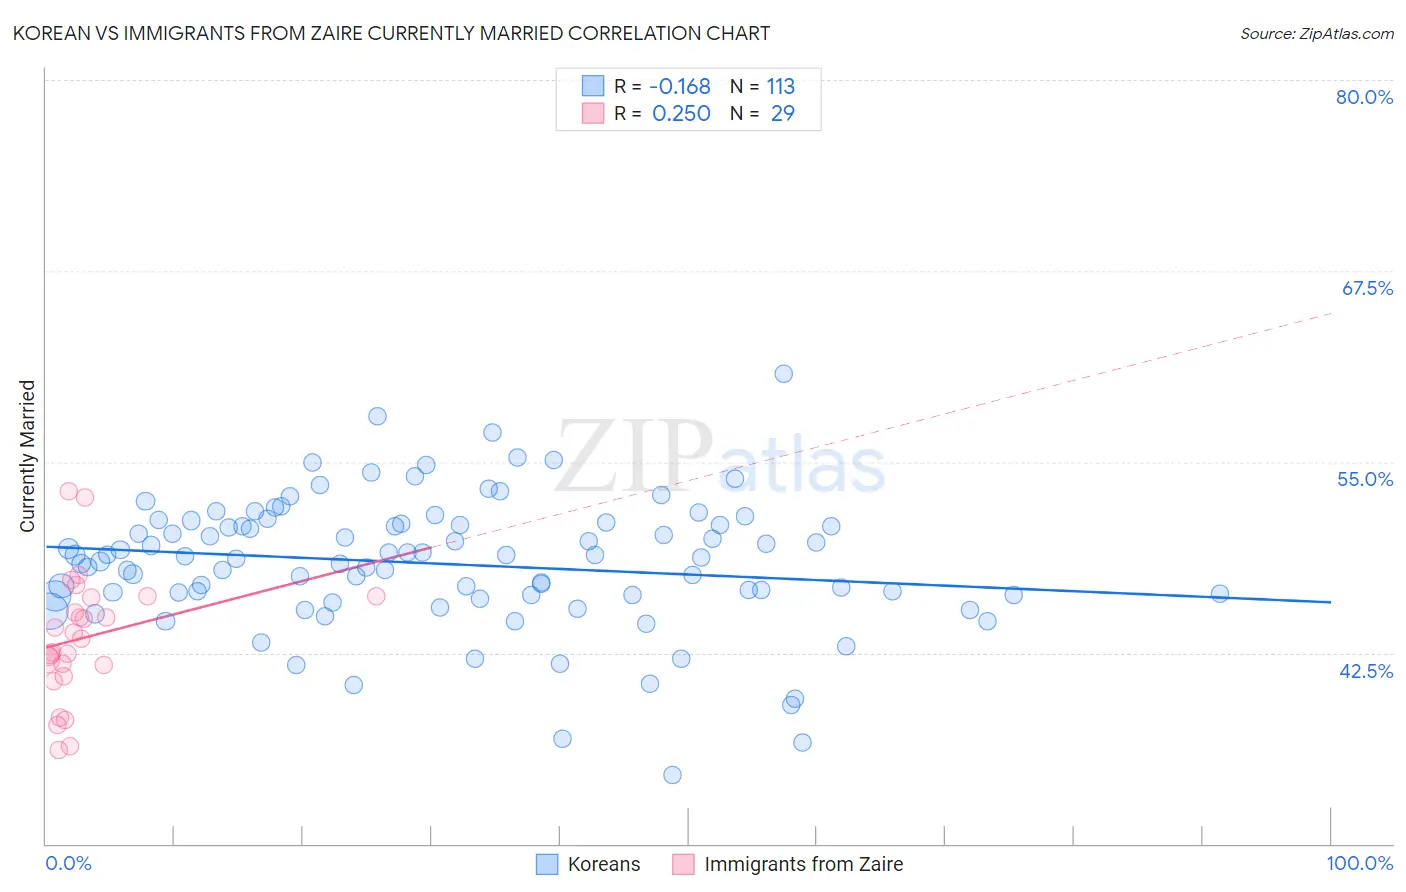
Korean vs Immigrants from Zaire Currently Married Correlation Chart
The statistical analysis conducted on geographies consisting of 510,845,444 people shows a poor negative correlation between the proportion of Koreans and percentage of population currently married in the United States with a correlation coefficient (R) of -0.168 and weighted average of 47.9%. Similarly, the statistical analysis conducted on geographies consisting of 107,251,110 people shows a weak positive correlation between the proportion of Immigrants from Zaire and percentage of population currently married in the United States with a correlation coefficient (R) of 0.250 and weighted average of 42.0%, a difference of 14.2%.
Currently Married Correlation Summary
| Measurement | Korean | Immigrants from Zaire |
| Minimum | 34.5% | 36.1% |
| Maximum | 60.8% | 53.1% |
| Range | 26.3% | 16.9% |
| Mean | 48.3% | 43.5% |
| Median | 48.7% | 43.4% |
| Interquartile 25% (IQ1) | 46.3% | 41.4% |
| Interquartile 75% (IQ3) | 50.9% | 46.1% |
| Interquartile Range (IQR) | 4.7% | 4.8% |
| Standard Deviation (Sample) | 4.3% | 4.1% |
| Standard Deviation (Population) | 4.3% | 4.0% |
Similar Demographics by Currently Married
Demographics Similar to Koreans by Currently Married
In terms of currently married, the demographic groups most similar to Koreans are Immigrants from Bolivia (47.9%, a difference of 0.040%), Lebanese (47.9%, a difference of 0.050%), American (48.0%, a difference of 0.070%), Native Hawaiian (47.9%, a difference of 0.070%), and Indian (Asian) (48.0%, a difference of 0.090%).
| Demographics | Rating | Rank | Currently Married |
| French Canadians | 96.3 /100 | #85 | Exceptional 48.0% |
| Immigrants | Japan | 96.2 /100 | #86 | Exceptional 48.0% |
| Jordanians | 96.2 /100 | #87 | Exceptional 48.0% |
| Immigrants | Eastern Europe | 96.1 /100 | #88 | Exceptional 48.0% |
| Indians (Asian) | 95.8 /100 | #89 | Exceptional 48.0% |
| Americans | 95.7 /100 | #90 | Exceptional 48.0% |
| Immigrants | Bolivia | 95.6 /100 | #91 | Exceptional 47.9% |
| Koreans | 95.4 /100 | #92 | Exceptional 47.9% |
| Lebanese | 95.1 /100 | #93 | Exceptional 47.9% |
| Native Hawaiians | 95.0 /100 | #94 | Exceptional 47.9% |
| Immigrants | Bulgaria | 94.8 /100 | #95 | Exceptional 47.9% |
| Egyptians | 94.8 /100 | #96 | Exceptional 47.9% |
| Immigrants | Ukraine | 94.8 /100 | #97 | Exceptional 47.9% |
| Immigrants | China | 94.7 /100 | #98 | Exceptional 47.9% |
| Immigrants | Sweden | 94.3 /100 | #99 | Exceptional 47.8% |
Demographics Similar to Immigrants from Zaire by Currently Married
In terms of currently married, the demographic groups most similar to Immigrants from Zaire are Sioux (41.9%, a difference of 0.010%), Immigrants from Bahamas (41.9%, a difference of 0.13%), Immigrants from Trinidad and Tobago (41.9%, a difference of 0.16%), Immigrants from Guyana (41.9%, a difference of 0.17%), and Immigrants from Yemen (42.1%, a difference of 0.25%).
| Demographics | Rating | Rank | Currently Married |
| Immigrants | Western Africa | 0.0 /100 | #295 | Tragic 42.4% |
| Menominee | 0.0 /100 | #296 | Tragic 42.3% |
| Cheyenne | 0.0 /100 | #297 | Tragic 42.2% |
| Immigrants | Honduras | 0.0 /100 | #298 | Tragic 42.2% |
| Liberians | 0.0 /100 | #299 | Tragic 42.2% |
| Belizeans | 0.0 /100 | #300 | Tragic 42.2% |
| Immigrants | Yemen | 0.0 /100 | #301 | Tragic 42.1% |
| Immigrants | Zaire | 0.0 /100 | #302 | Tragic 42.0% |
| Sioux | 0.0 /100 | #303 | Tragic 41.9% |
| Immigrants | Bahamas | 0.0 /100 | #304 | Tragic 41.9% |
| Immigrants | Trinidad and Tobago | 0.0 /100 | #305 | Tragic 41.9% |
| Immigrants | Guyana | 0.0 /100 | #306 | Tragic 41.9% |
| Africans | 0.0 /100 | #307 | Tragic 41.8% |
| Immigrants | Belize | 0.0 /100 | #308 | Tragic 41.8% |
| Immigrants | Liberia | 0.0 /100 | #309 | Tragic 41.8% |