Korean vs Immigrants from the Azores Currently Married
COMPARE
Korean
Immigrants from the Azores
Currently Married
Currently Married Comparison
Koreans
Immigrants from the Azores
47.9%
CURRENTLY MARRIED
95.4/ 100
METRIC RATING
92nd/ 347
METRIC RANK
45.1%
CURRENTLY MARRIED
2.5/ 100
METRIC RATING
222nd/ 347
METRIC RANK
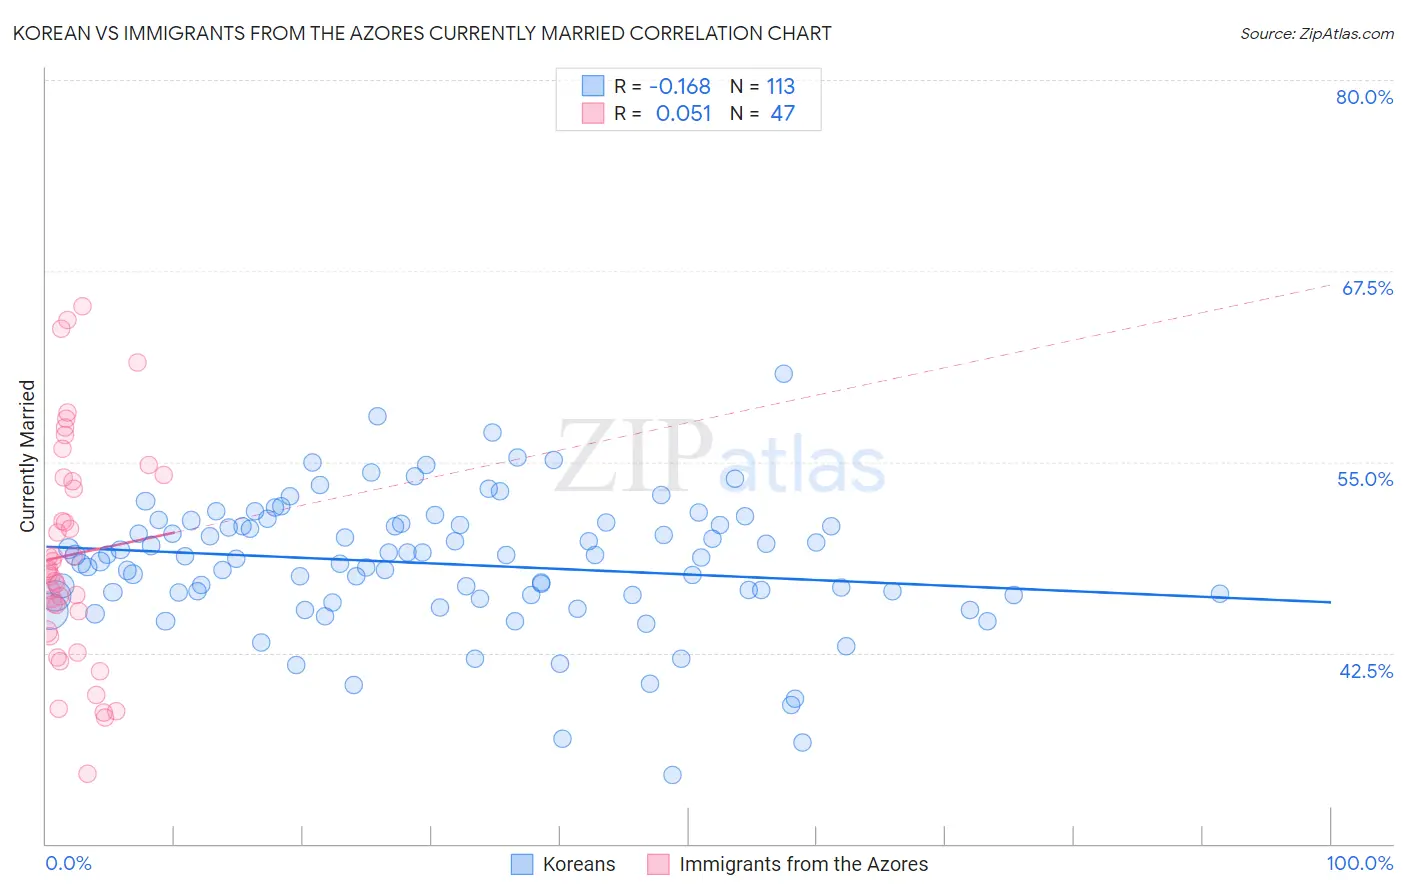
Korean vs Immigrants from the Azores Currently Married Correlation Chart
The statistical analysis conducted on geographies consisting of 510,845,444 people shows a poor negative correlation between the proportion of Koreans and percentage of population currently married in the United States with a correlation coefficient (R) of -0.168 and weighted average of 47.9%. Similarly, the statistical analysis conducted on geographies consisting of 46,256,915 people shows a slight positive correlation between the proportion of Immigrants from the Azores and percentage of population currently married in the United States with a correlation coefficient (R) of 0.051 and weighted average of 45.1%, a difference of 6.3%.
Currently Married Correlation Summary
| Measurement | Korean | Immigrants from the Azores |
| Minimum | 34.5% | 34.6% |
| Maximum | 60.8% | 65.2% |
| Range | 26.3% | 30.6% |
| Mean | 48.3% | 48.9% |
| Median | 48.7% | 47.9% |
| Interquartile 25% (IQ1) | 46.3% | 43.9% |
| Interquartile 75% (IQ3) | 50.9% | 54.0% |
| Interquartile Range (IQR) | 4.7% | 10.1% |
| Standard Deviation (Sample) | 4.3% | 7.2% |
| Standard Deviation (Population) | 4.3% | 7.2% |
Similar Demographics by Currently Married
Demographics Similar to Koreans by Currently Married
In terms of currently married, the demographic groups most similar to Koreans are Immigrants from Bolivia (47.9%, a difference of 0.040%), Lebanese (47.9%, a difference of 0.050%), American (48.0%, a difference of 0.070%), Native Hawaiian (47.9%, a difference of 0.070%), and Indian (Asian) (48.0%, a difference of 0.090%).
| Demographics | Rating | Rank | Currently Married |
| French Canadians | 96.3 /100 | #85 | Exceptional 48.0% |
| Immigrants | Japan | 96.2 /100 | #86 | Exceptional 48.0% |
| Jordanians | 96.2 /100 | #87 | Exceptional 48.0% |
| Immigrants | Eastern Europe | 96.1 /100 | #88 | Exceptional 48.0% |
| Indians (Asian) | 95.8 /100 | #89 | Exceptional 48.0% |
| Americans | 95.7 /100 | #90 | Exceptional 48.0% |
| Immigrants | Bolivia | 95.6 /100 | #91 | Exceptional 47.9% |
| Koreans | 95.4 /100 | #92 | Exceptional 47.9% |
| Lebanese | 95.1 /100 | #93 | Exceptional 47.9% |
| Native Hawaiians | 95.0 /100 | #94 | Exceptional 47.9% |
| Immigrants | Bulgaria | 94.8 /100 | #95 | Exceptional 47.9% |
| Egyptians | 94.8 /100 | #96 | Exceptional 47.9% |
| Immigrants | Ukraine | 94.8 /100 | #97 | Exceptional 47.9% |
| Immigrants | China | 94.7 /100 | #98 | Exceptional 47.9% |
| Immigrants | Sweden | 94.3 /100 | #99 | Exceptional 47.8% |
Demographics Similar to Immigrants from the Azores by Currently Married
In terms of currently married, the demographic groups most similar to Immigrants from the Azores are Immigrants from Laos (45.0%, a difference of 0.080%), Immigrants from Uganda (45.0%, a difference of 0.13%), French American Indian (45.0%, a difference of 0.13%), Comanche (45.0%, a difference of 0.18%), and Spanish American (45.0%, a difference of 0.18%).
| Demographics | Rating | Rank | Currently Married |
| German Russians | 6.7 /100 | #215 | Tragic 45.5% |
| Immigrants | Morocco | 5.5 /100 | #216 | Tragic 45.4% |
| Immigrants | Thailand | 5.1 /100 | #217 | Tragic 45.4% |
| Panamanians | 4.0 /100 | #218 | Tragic 45.3% |
| Immigrants | Portugal | 3.5 /100 | #219 | Tragic 45.2% |
| Kenyans | 3.1 /100 | #220 | Tragic 45.2% |
| Mexicans | 3.0 /100 | #221 | Tragic 45.2% |
| Immigrants | Azores | 2.5 /100 | #222 | Tragic 45.1% |
| Immigrants | Laos | 2.3 /100 | #223 | Tragic 45.0% |
| Immigrants | Uganda | 2.2 /100 | #224 | Tragic 45.0% |
| French American Indians | 2.2 /100 | #225 | Tragic 45.0% |
| Comanche | 2.1 /100 | #226 | Tragic 45.0% |
| Spanish Americans | 2.1 /100 | #227 | Tragic 45.0% |
| Immigrants | Uruguay | 2.0 /100 | #228 | Tragic 45.0% |
| Cree | 1.7 /100 | #229 | Tragic 44.9% |