Korean vs Immigrants from Nepal 11th Grade
COMPARE
Korean
Immigrants from Nepal
11th Grade
11th Grade Comparison
Koreans
Immigrants from Nepal
92.1%
11TH GRADE
14.4/ 100
METRIC RATING
212th/ 347
METRIC RANK
92.4%
11TH GRADE
36.4/ 100
METRIC RATING
185th/ 347
METRIC RANK
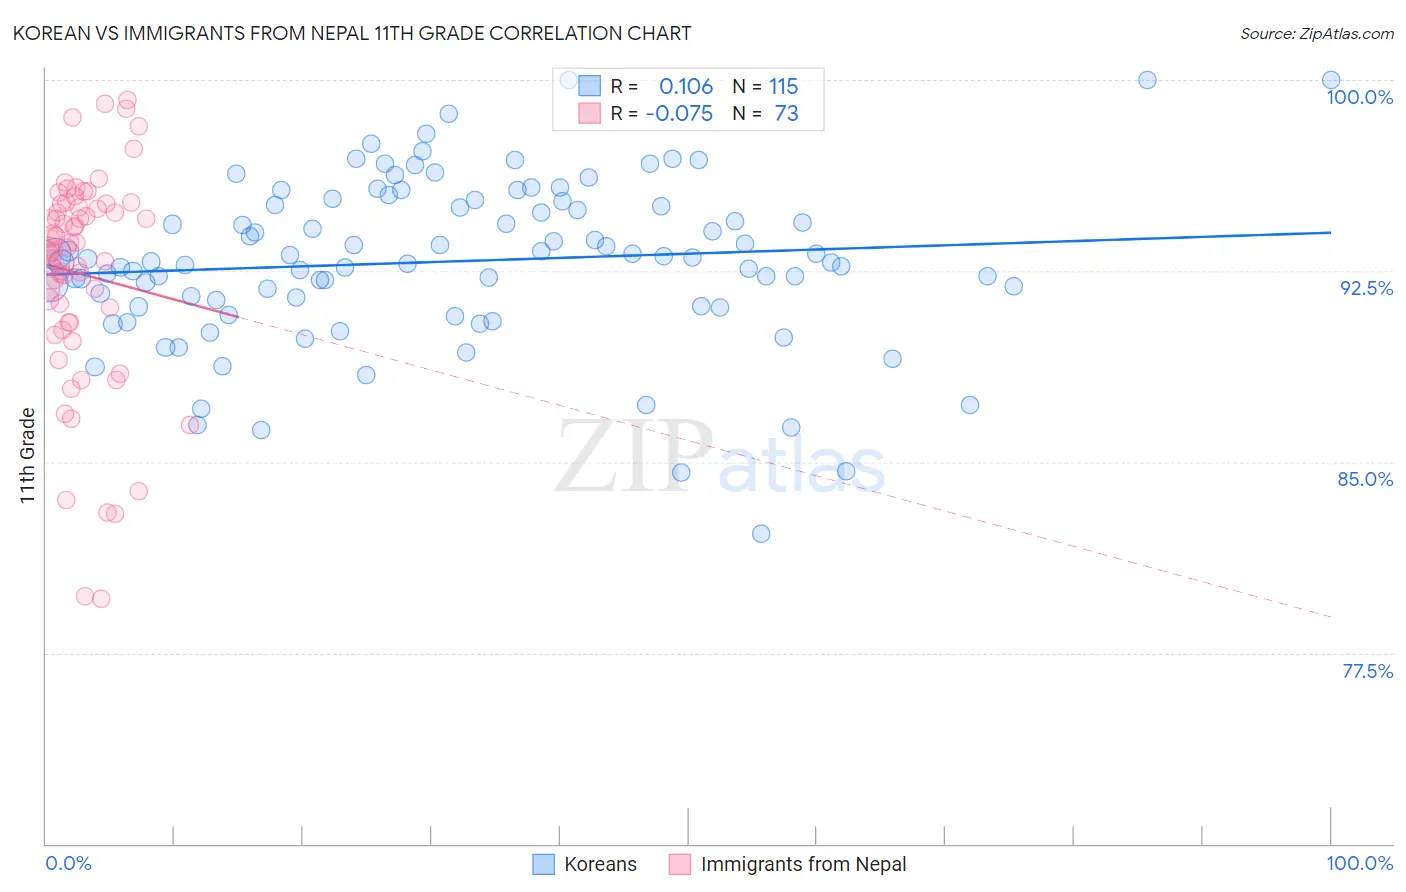
Korean vs Immigrants from Nepal 11th Grade Correlation Chart
The statistical analysis conducted on geographies consisting of 510,943,943 people shows a poor positive correlation between the proportion of Koreans and percentage of population with at least 11th grade education in the United States with a correlation coefficient (R) of 0.106 and weighted average of 92.1%. Similarly, the statistical analysis conducted on geographies consisting of 186,780,807 people shows a slight negative correlation between the proportion of Immigrants from Nepal and percentage of population with at least 11th grade education in the United States with a correlation coefficient (R) of -0.075 and weighted average of 92.4%, a difference of 0.30%.
11th Grade Correlation Summary
| Measurement | Korean | Immigrants from Nepal |
| Minimum | 82.2% | 79.6% |
| Maximum | 100.0% | 99.2% |
| Range | 17.8% | 19.6% |
| Mean | 92.9% | 92.4% |
| Median | 92.9% | 93.4% |
| Interquartile 25% (IQ1) | 91.1% | 90.5% |
| Interquartile 75% (IQ3) | 95.1% | 95.1% |
| Interquartile Range (IQR) | 3.9% | 4.6% |
| Standard Deviation (Sample) | 3.2% | 4.2% |
| Standard Deviation (Population) | 3.2% | 4.2% |
Similar Demographics by 11th Grade
Demographics Similar to Koreans by 11th Grade
In terms of 11th grade, the demographic groups most similar to Koreans are Immigrants from Ethiopia (92.1%, a difference of 0.010%), Afghan (92.1%, a difference of 0.030%), Immigrants from Southern Europe (92.1%, a difference of 0.040%), Immigrants from Micronesia (92.2%, a difference of 0.060%), and Somali (92.1%, a difference of 0.060%).
| Demographics | Rating | Rank | 11th Grade |
| Kiowa | 23.2 /100 | #205 | Fair 92.2% |
| Bolivians | 23.2 /100 | #206 | Fair 92.2% |
| Immigrants | Oceania | 22.4 /100 | #207 | Fair 92.2% |
| Colville | 21.8 /100 | #208 | Fair 92.2% |
| Tongans | 19.8 /100 | #209 | Poor 92.2% |
| Ethiopians | 18.8 /100 | #210 | Poor 92.2% |
| Immigrants | Micronesia | 17.7 /100 | #211 | Poor 92.2% |
| Koreans | 14.4 /100 | #212 | Poor 92.1% |
| Immigrants | Ethiopia | 13.9 /100 | #213 | Poor 92.1% |
| Afghans | 12.8 /100 | #214 | Poor 92.1% |
| Immigrants | Southern Europe | 12.5 /100 | #215 | Poor 92.1% |
| Somalis | 11.6 /100 | #216 | Poor 92.1% |
| Immigrants | Sierra Leone | 11.1 /100 | #217 | Poor 92.0% |
| Blackfeet | 10.1 /100 | #218 | Poor 92.0% |
| Portuguese | 10.0 /100 | #219 | Tragic 92.0% |
Demographics Similar to Immigrants from Nepal by 11th Grade
In terms of 11th grade, the demographic groups most similar to Immigrants from Nepal are Immigrants from Malaysia (92.4%, a difference of 0.010%), Immigrants from Asia (92.4%, a difference of 0.010%), Arapaho (92.4%, a difference of 0.010%), Immigrants from Morocco (92.4%, a difference of 0.020%), and Immigrants from Western Asia (92.4%, a difference of 0.020%).
| Demographics | Rating | Rank | 11th Grade |
| Sudanese | 43.4 /100 | #178 | Average 92.5% |
| Creek | 40.9 /100 | #179 | Average 92.4% |
| Inupiat | 40.7 /100 | #180 | Average 92.4% |
| Cherokee | 40.7 /100 | #181 | Average 92.4% |
| Immigrants | Morocco | 38.6 /100 | #182 | Fair 92.4% |
| Immigrants | Malaysia | 37.6 /100 | #183 | Fair 92.4% |
| Immigrants | Asia | 37.4 /100 | #184 | Fair 92.4% |
| Immigrants | Nepal | 36.4 /100 | #185 | Fair 92.4% |
| Arapaho | 35.1 /100 | #186 | Fair 92.4% |
| Immigrants | Western Asia | 35.0 /100 | #187 | Fair 92.4% |
| Immigrants | Indonesia | 33.7 /100 | #188 | Fair 92.4% |
| Immigrants | Chile | 33.3 /100 | #189 | Fair 92.4% |
| Chickasaw | 31.4 /100 | #190 | Fair 92.3% |
| French American Indians | 30.8 /100 | #191 | Fair 92.3% |
| Immigrants | Syria | 30.4 /100 | #192 | Fair 92.3% |