Korean vs Immigrants from Nepal Householder Income Ages 45 - 64 years
COMPARE
Korean
Immigrants from Nepal
Householder Income Ages 45 - 64 years
Householder Income Ages 45 - 64 years Comparison
Koreans
Immigrants from Nepal
$110,334
HOUSEHOLDER INCOME AGES 45 - 64 YEARS
99.3/ 100
METRIC RATING
70th/ 347
METRIC RANK
$102,190
HOUSEHOLDER INCOME AGES 45 - 64 YEARS
71.8/ 100
METRIC RATING
161st/ 347
METRIC RANK
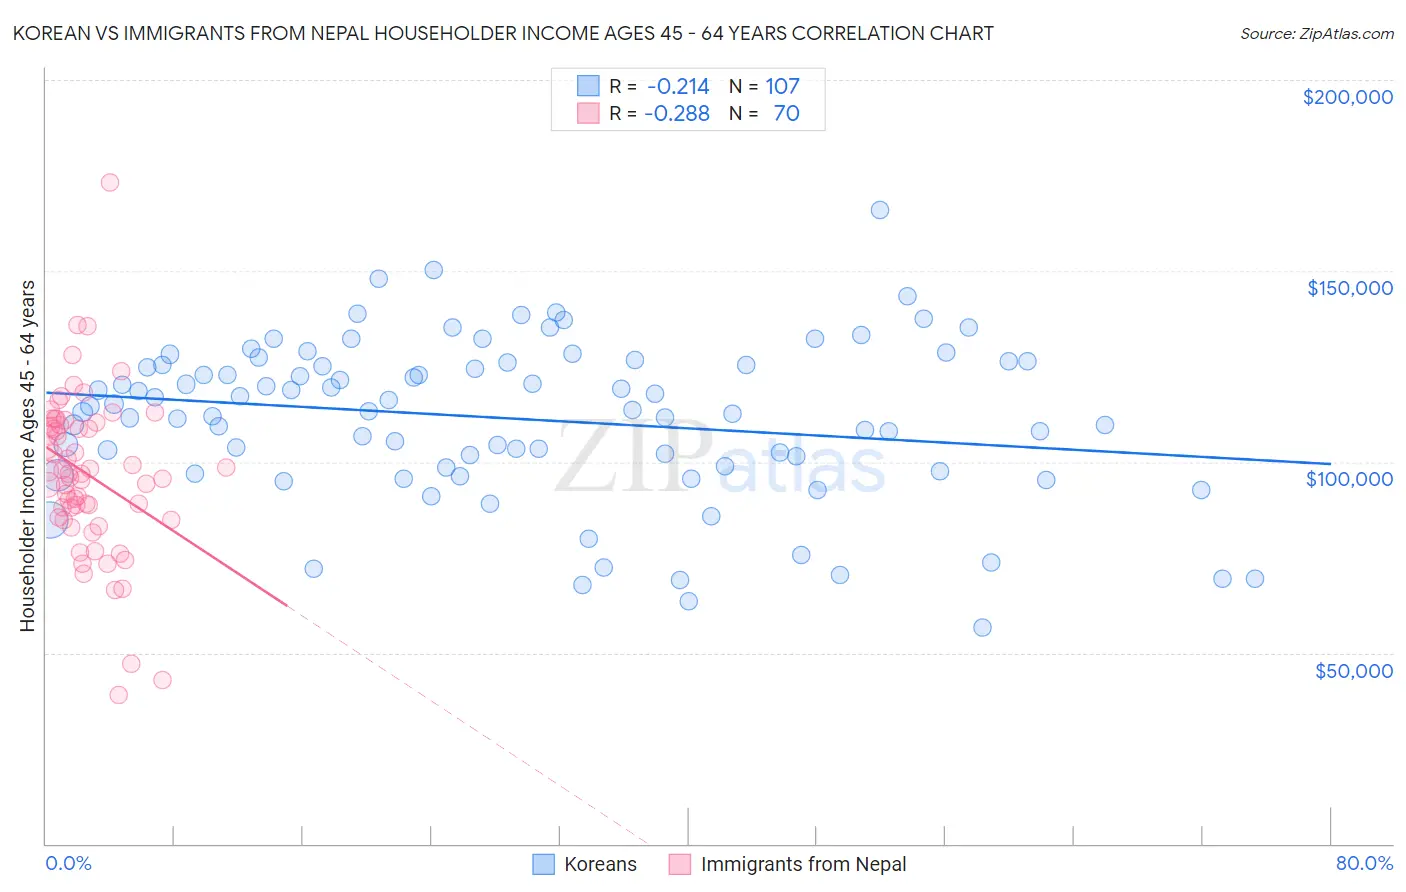
Korean vs Immigrants from Nepal Householder Income Ages 45 - 64 years Correlation Chart
The statistical analysis conducted on geographies consisting of 509,189,713 people shows a weak negative correlation between the proportion of Koreans and household income with householder between the ages 45 and 64 in the United States with a correlation coefficient (R) of -0.214 and weighted average of $110,334. Similarly, the statistical analysis conducted on geographies consisting of 186,605,051 people shows a weak negative correlation between the proportion of Immigrants from Nepal and household income with householder between the ages 45 and 64 in the United States with a correlation coefficient (R) of -0.288 and weighted average of $102,190, a difference of 8.0%.
Householder Income Ages 45 - 64 years Correlation Summary
| Measurement | Korean | Immigrants from Nepal |
| Minimum | $56,563 | $38,929 |
| Maximum | $166,010 | $173,233 |
| Range | $109,447 | $134,304 |
| Mean | $111,314 | $96,757 |
| Median | $113,513 | $96,927 |
| Interquartile 25% (IQ1) | $98,457 | $85,480 |
| Interquartile 75% (IQ3) | $126,141 | $109,661 |
| Interquartile Range (IQR) | $27,684 | $24,181 |
| Standard Deviation (Sample) | $20,923 | $21,222 |
| Standard Deviation (Population) | $20,825 | $21,070 |
Similar Demographics by Householder Income Ages 45 - 64 years
Demographics Similar to Koreans by Householder Income Ages 45 - 64 years
In terms of householder income ages 45 - 64 years, the demographic groups most similar to Koreans are Immigrants from Italy ($110,434, a difference of 0.090%), Italian ($110,224, a difference of 0.10%), Assyrian/Chaldean/Syriac ($110,201, a difference of 0.12%), Argentinean ($110,103, a difference of 0.21%), and Immigrants from Romania ($110,633, a difference of 0.27%).
| Demographics | Rating | Rank | Householder Income Ages 45 - 64 years |
| Mongolians | 99.6 /100 | #63 | Exceptional $111,602 |
| Immigrants | Latvia | 99.6 /100 | #64 | Exceptional $111,454 |
| Immigrants | Belarus | 99.6 /100 | #65 | Exceptional $111,430 |
| New Zealanders | 99.6 /100 | #66 | Exceptional $111,286 |
| Laotians | 99.5 /100 | #67 | Exceptional $111,051 |
| Immigrants | Romania | 99.4 /100 | #68 | Exceptional $110,633 |
| Immigrants | Italy | 99.4 /100 | #69 | Exceptional $110,434 |
| Koreans | 99.3 /100 | #70 | Exceptional $110,334 |
| Italians | 99.3 /100 | #71 | Exceptional $110,224 |
| Assyrians/Chaldeans/Syriacs | 99.3 /100 | #72 | Exceptional $110,201 |
| Argentineans | 99.3 /100 | #73 | Exceptional $110,103 |
| Immigrants | Egypt | 99.2 /100 | #74 | Exceptional $109,941 |
| South Africans | 99.1 /100 | #75 | Exceptional $109,719 |
| Paraguayans | 99.0 /100 | #76 | Exceptional $109,447 |
| Immigrants | England | 99.0 /100 | #77 | Exceptional $109,446 |
Demographics Similar to Immigrants from Nepal by Householder Income Ages 45 - 64 years
In terms of householder income ages 45 - 64 years, the demographic groups most similar to Immigrants from Nepal are Icelander ($102,261, a difference of 0.070%), Scottish ($102,123, a difference of 0.070%), English ($102,021, a difference of 0.17%), Immigrants from Morocco ($102,015, a difference of 0.17%), and Sierra Leonean ($102,427, a difference of 0.23%).
| Demographics | Rating | Rank | Householder Income Ages 45 - 64 years |
| Slovenes | 78.3 /100 | #154 | Good $102,885 |
| Costa Ricans | 77.4 /100 | #155 | Good $102,779 |
| Carpatho Rusyns | 77.4 /100 | #156 | Good $102,777 |
| Immigrants | Ethiopia | 77.3 /100 | #157 | Good $102,763 |
| Slavs | 76.1 /100 | #158 | Good $102,629 |
| Sierra Leoneans | 74.2 /100 | #159 | Good $102,427 |
| Icelanders | 72.5 /100 | #160 | Good $102,261 |
| Immigrants | Nepal | 71.8 /100 | #161 | Good $102,190 |
| Scottish | 71.1 /100 | #162 | Good $102,123 |
| English | 70.1 /100 | #163 | Good $102,021 |
| Immigrants | Morocco | 70.0 /100 | #164 | Good $102,015 |
| Immigrants | Albania | 69.4 /100 | #165 | Good $101,957 |
| Samoans | 65.3 /100 | #166 | Good $101,580 |
| Czechoslovakians | 63.0 /100 | #167 | Good $101,387 |
| South American Indians | 60.5 /100 | #168 | Good $101,171 |