Korean vs Palestinian Currently Married
COMPARE
Korean
Palestinian
Currently Married
Currently Married Comparison
Koreans
Palestinians
47.9%
CURRENTLY MARRIED
95.4/ 100
METRIC RATING
92nd/ 347
METRIC RANK
47.6%
CURRENTLY MARRIED
90.4/ 100
METRIC RATING
116th/ 347
METRIC RANK
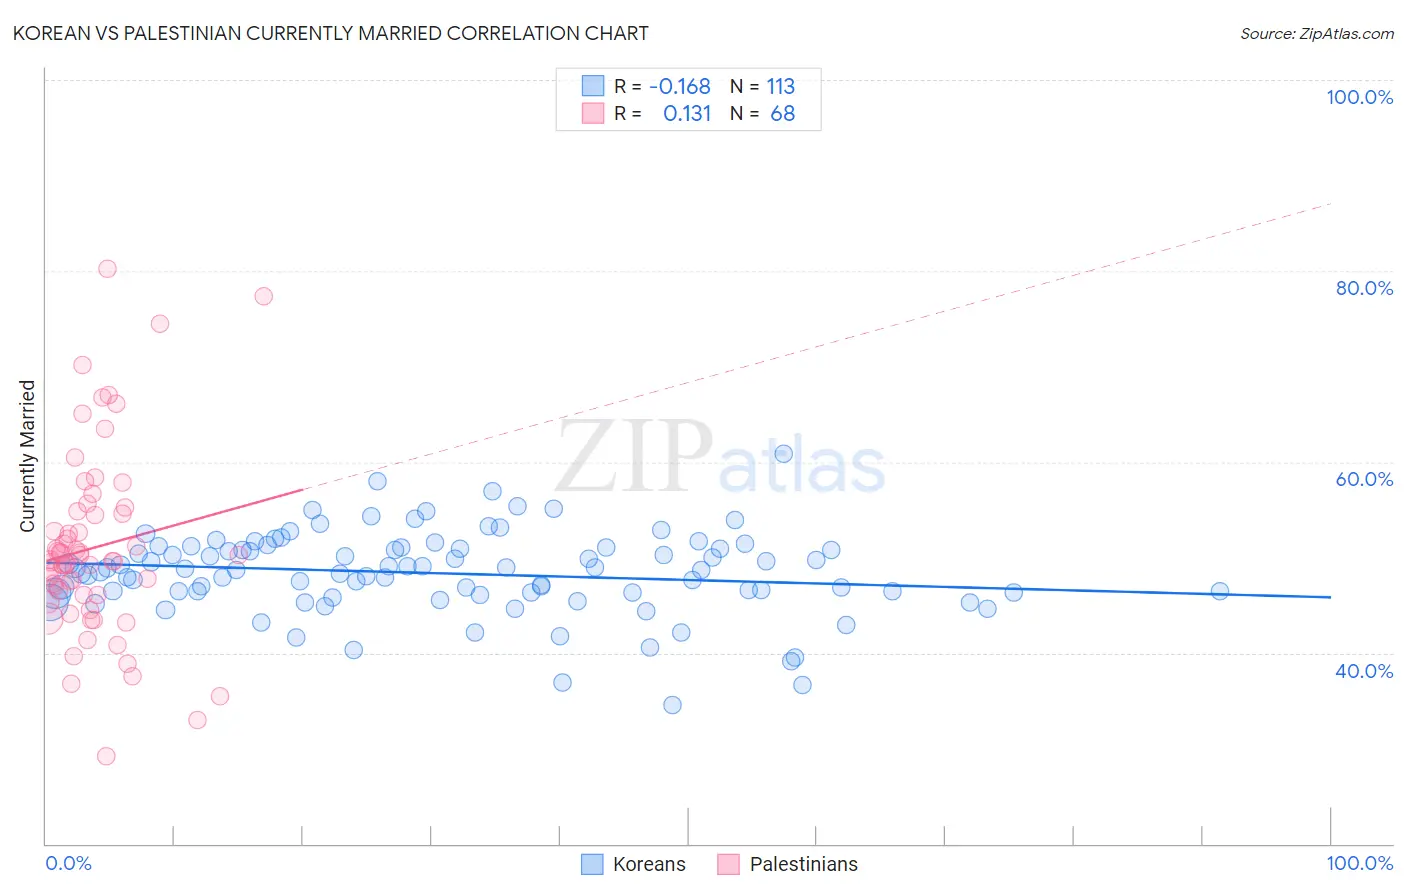
Korean vs Palestinian Currently Married Correlation Chart
The statistical analysis conducted on geographies consisting of 510,845,444 people shows a poor negative correlation between the proportion of Koreans and percentage of population currently married in the United States with a correlation coefficient (R) of -0.168 and weighted average of 47.9%. Similarly, the statistical analysis conducted on geographies consisting of 216,437,079 people shows a poor positive correlation between the proportion of Palestinians and percentage of population currently married in the United States with a correlation coefficient (R) of 0.131 and weighted average of 47.6%, a difference of 0.70%.
Currently Married Correlation Summary
| Measurement | Korean | Palestinian |
| Minimum | 34.5% | 29.1% |
| Maximum | 60.8% | 80.2% |
| Range | 26.3% | 51.1% |
| Mean | 48.3% | 51.0% |
| Median | 48.7% | 49.7% |
| Interquartile 25% (IQ1) | 46.3% | 46.0% |
| Interquartile 75% (IQ3) | 50.9% | 54.7% |
| Interquartile Range (IQR) | 4.7% | 8.7% |
| Standard Deviation (Sample) | 4.3% | 9.7% |
| Standard Deviation (Population) | 4.3% | 9.7% |
Similar Demographics by Currently Married
Demographics Similar to Koreans by Currently Married
In terms of currently married, the demographic groups most similar to Koreans are Immigrants from Bolivia (47.9%, a difference of 0.040%), Lebanese (47.9%, a difference of 0.050%), American (48.0%, a difference of 0.070%), Native Hawaiian (47.9%, a difference of 0.070%), and Indian (Asian) (48.0%, a difference of 0.090%).
| Demographics | Rating | Rank | Currently Married |
| French Canadians | 96.3 /100 | #85 | Exceptional 48.0% |
| Immigrants | Japan | 96.2 /100 | #86 | Exceptional 48.0% |
| Jordanians | 96.2 /100 | #87 | Exceptional 48.0% |
| Immigrants | Eastern Europe | 96.1 /100 | #88 | Exceptional 48.0% |
| Indians (Asian) | 95.8 /100 | #89 | Exceptional 48.0% |
| Americans | 95.7 /100 | #90 | Exceptional 48.0% |
| Immigrants | Bolivia | 95.6 /100 | #91 | Exceptional 47.9% |
| Koreans | 95.4 /100 | #92 | Exceptional 47.9% |
| Lebanese | 95.1 /100 | #93 | Exceptional 47.9% |
| Native Hawaiians | 95.0 /100 | #94 | Exceptional 47.9% |
| Immigrants | Bulgaria | 94.8 /100 | #95 | Exceptional 47.9% |
| Egyptians | 94.8 /100 | #96 | Exceptional 47.9% |
| Immigrants | Ukraine | 94.8 /100 | #97 | Exceptional 47.9% |
| Immigrants | China | 94.7 /100 | #98 | Exceptional 47.9% |
| Immigrants | Sweden | 94.3 /100 | #99 | Exceptional 47.8% |
Demographics Similar to Palestinians by Currently Married
In terms of currently married, the demographic groups most similar to Palestinians are South African (47.6%, a difference of 0.010%), Immigrants from Indonesia (47.6%, a difference of 0.010%), Puget Sound Salish (47.6%, a difference of 0.020%), Immigrants from Philippines (47.6%, a difference of 0.020%), and Australian (47.6%, a difference of 0.020%).
| Demographics | Rating | Rank | Currently Married |
| Immigrants | Egypt | 92.3 /100 | #109 | Exceptional 47.7% |
| Immigrants | Russia | 92.0 /100 | #110 | Exceptional 47.7% |
| Immigrants | Hungary | 91.2 /100 | #111 | Exceptional 47.6% |
| Immigrants | Western Europe | 91.1 /100 | #112 | Exceptional 47.6% |
| Immigrants | Denmark | 90.9 /100 | #113 | Exceptional 47.6% |
| South Africans | 90.5 /100 | #114 | Exceptional 47.6% |
| Immigrants | Indonesia | 90.5 /100 | #115 | Exceptional 47.6% |
| Palestinians | 90.4 /100 | #116 | Exceptional 47.6% |
| Puget Sound Salish | 90.3 /100 | #117 | Exceptional 47.6% |
| Immigrants | Philippines | 90.2 /100 | #118 | Exceptional 47.6% |
| Australians | 90.2 /100 | #119 | Exceptional 47.6% |
| Syrians | 88.9 /100 | #120 | Excellent 47.5% |
| Immigrants | Croatia | 88.6 /100 | #121 | Excellent 47.5% |
| Osage | 87.9 /100 | #122 | Excellent 47.5% |
| Immigrants | Kazakhstan | 87.2 /100 | #123 | Excellent 47.4% |