Kiowa vs Immigrants from Western Europe Births to Unmarried Women
COMPARE
Kiowa
Immigrants from Western Europe
Births to Unmarried Women
Births to Unmarried Women Comparison
Kiowa
Immigrants from Western Europe
43.1%
BIRTHS TO UNMARRIED WOMEN
0.0/ 100
METRIC RATING
332nd/ 347
METRIC RANK
31.1%
BIRTHS TO UNMARRIED WOMEN
69.3/ 100
METRIC RATING
160th/ 347
METRIC RANK
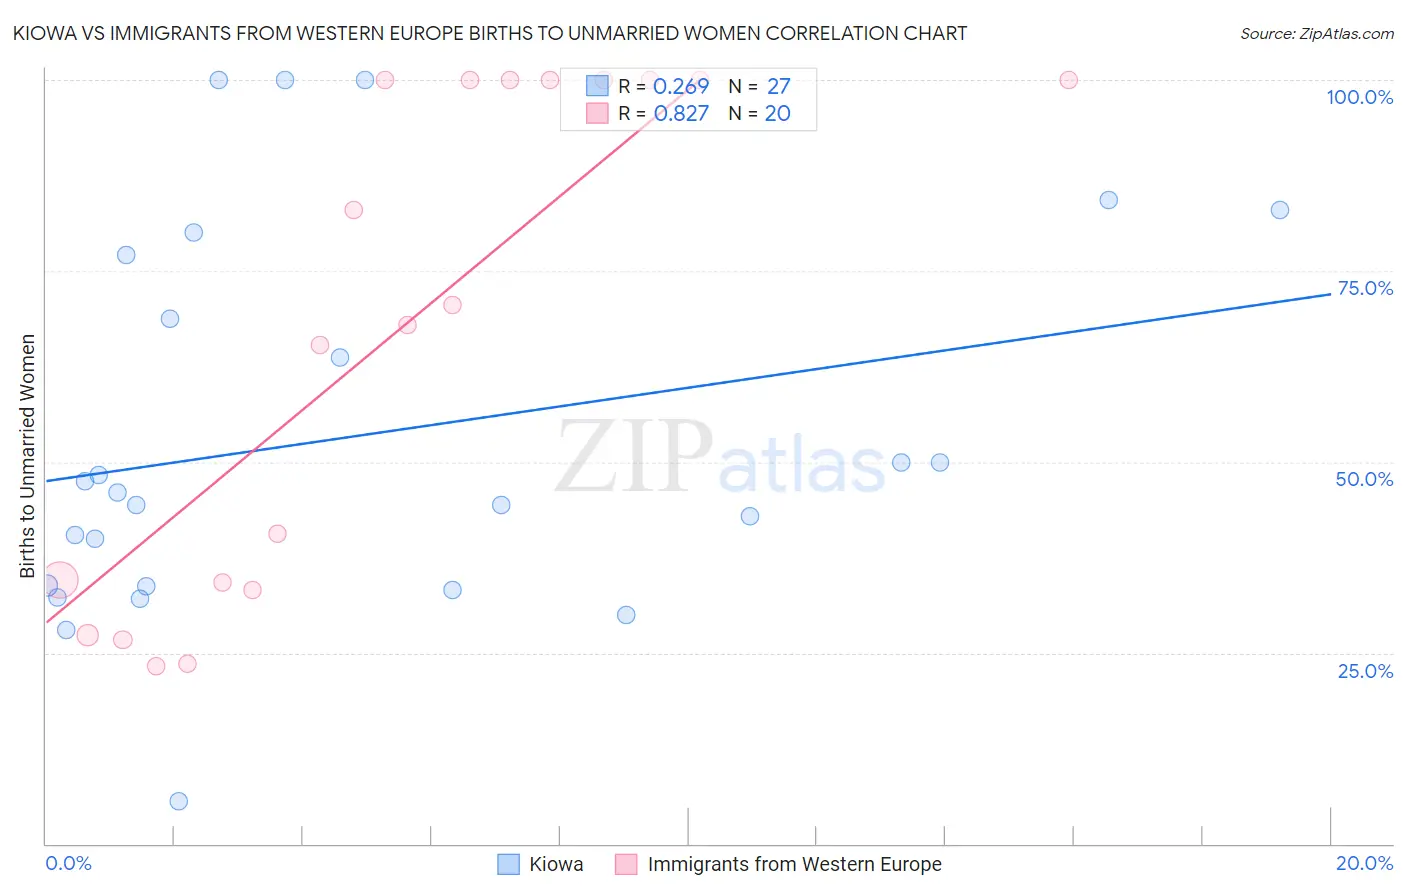
Kiowa vs Immigrants from Western Europe Births to Unmarried Women Correlation Chart
The statistical analysis conducted on geographies consisting of 55,598,383 people shows a weak positive correlation between the proportion of Kiowa and percentage of births to unmarried women in the United States with a correlation coefficient (R) of 0.269 and weighted average of 43.1%. Similarly, the statistical analysis conducted on geographies consisting of 450,880,504 people shows a very strong positive correlation between the proportion of Immigrants from Western Europe and percentage of births to unmarried women in the United States with a correlation coefficient (R) of 0.827 and weighted average of 31.1%, a difference of 38.9%.
Births to Unmarried Women Correlation Summary
| Measurement | Kiowa | Immigrants from Western Europe |
| Minimum | 5.6% | 23.3% |
| Maximum | 100.0% | 100.0% |
| Range | 94.4% | 76.7% |
| Mean | 53.3% | 66.5% |
| Median | 46.0% | 69.3% |
| Interquartile 25% (IQ1) | 33.8% | 33.7% |
| Interquartile 75% (IQ3) | 77.0% | 100.0% |
| Interquartile Range (IQR) | 43.2% | 66.3% |
| Standard Deviation (Sample) | 25.0% | 32.4% |
| Standard Deviation (Population) | 24.5% | 31.6% |
Similar Demographics by Births to Unmarried Women
Demographics Similar to Kiowa by Births to Unmarried Women
In terms of births to unmarried women, the demographic groups most similar to Kiowa are Native/Alaskan (43.0%, a difference of 0.35%), Chippewa (42.6%, a difference of 1.2%), Paiute (42.5%, a difference of 1.6%), Immigrants from Cabo Verde (42.2%, a difference of 2.2%), and Tsimshian (42.2%, a difference of 2.3%).
| Demographics | Rating | Rank | Births to Unmarried Women |
| Cheyenne | 0.0 /100 | #325 | Tragic 41.3% |
| Immigrants | Cuba | 0.0 /100 | #326 | Tragic 41.5% |
| Tsimshian | 0.0 /100 | #327 | Tragic 42.2% |
| Immigrants | Cabo Verde | 0.0 /100 | #328 | Tragic 42.2% |
| Paiute | 0.0 /100 | #329 | Tragic 42.5% |
| Chippewa | 0.0 /100 | #330 | Tragic 42.6% |
| Natives/Alaskans | 0.0 /100 | #331 | Tragic 43.0% |
| Kiowa | 0.0 /100 | #332 | Tragic 43.1% |
| Blacks/African Americans | 0.0 /100 | #333 | Tragic 44.3% |
| Yuman | 0.0 /100 | #334 | Tragic 44.4% |
| Colville | 0.0 /100 | #335 | Tragic 45.3% |
| Puerto Ricans | 0.0 /100 | #336 | Tragic 45.7% |
| Houma | 0.0 /100 | #337 | Tragic 46.6% |
| Arapaho | 0.0 /100 | #338 | Tragic 47.1% |
| Lumbee | 0.0 /100 | #339 | Tragic 48.2% |
Demographics Similar to Immigrants from Western Europe by Births to Unmarried Women
In terms of births to unmarried women, the demographic groups most similar to Immigrants from Western Europe are Immigrants from England (31.1%, a difference of 0.0%), Austrian (31.0%, a difference of 0.060%), Immigrants from Southern Europe (31.1%, a difference of 0.070%), Immigrants from Eastern Africa (31.0%, a difference of 0.33%), and Slovene (31.2%, a difference of 0.38%).
| Demographics | Rating | Rank | Births to Unmarried Women |
| British | 76.0 /100 | #153 | Good 30.8% |
| Yugoslavians | 75.1 /100 | #154 | Good 30.8% |
| Immigrants | Bangladesh | 73.9 /100 | #155 | Good 30.9% |
| Carpatho Rusyns | 73.5 /100 | #156 | Good 30.9% |
| Immigrants | Eastern Africa | 72.1 /100 | #157 | Good 31.0% |
| Austrians | 69.9 /100 | #158 | Good 31.0% |
| Immigrants | England | 69.4 /100 | #159 | Good 31.1% |
| Immigrants | Western Europe | 69.3 /100 | #160 | Good 31.1% |
| Immigrants | Southern Europe | 68.7 /100 | #161 | Good 31.1% |
| Slovenes | 65.9 /100 | #162 | Good 31.2% |
| Immigrants | Chile | 65.7 /100 | #163 | Good 31.2% |
| Hungarians | 64.1 /100 | #164 | Good 31.2% |
| Immigrants | Somalia | 58.1 /100 | #165 | Average 31.4% |
| Peruvians | 55.5 /100 | #166 | Average 31.5% |
| Dutch | 55.3 /100 | #167 | Average 31.5% |